Download
1 / 24
240 likes | 405 Views
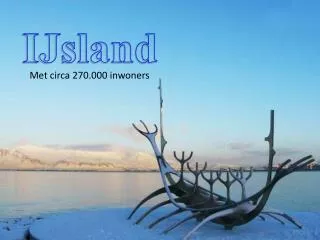
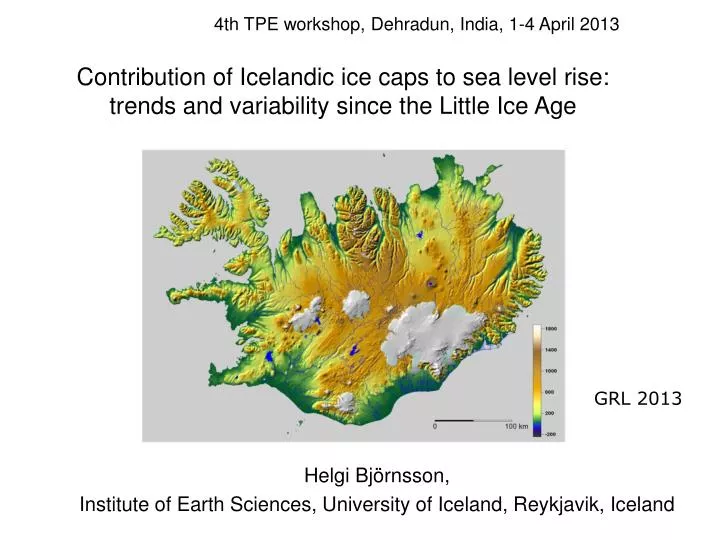
4th TPE workshop , Dehradun , India , 1-4 April 2013. Contribution of Icelandic ice caps to sea level rise : trends and variability since the Little Ice Age. GRL 2013. Helgi Björnsson, Institute of Earth Sciences, University of Iceland, Reykjavik, Iceland.

E N D
4th TPE workshop, Dehradun, India, 1-4 April 2013 Contribution of Icelandicicecapstosealevelrise: trends and variabilitysincetheLittleIceAge GRL 2013 Helgi Björnsson, Institute of Earth Sciences, University of Iceland, Reykjavik, Iceland
Contributiontostudies of global changes of glaciersin the hydrological cycle 0,001% 0,01% 2,15% 0,63% 97,2%
Sea level change Dh:20-50 cm Rate of rise 1993-2003 3.1± 0.7 mm year-1 Varmaútþensla Contributions: Dh ~20-30 cm Antarctica ? ? Greenland Glaciers outside north and south polar regions Thermal expansion IPCC AR4 2007
Latestreports (2005-2010) of sealevelrise: 3.3± 0.7 mm yr-1 Thermalexpansion less than 50% West-Antarcticaand Greenlandreactingfastertoglobalwarmingthanmodelshavebeenabletopredict Antarctica 0.3 mm yr-1 Futureprognoses of rising sealevel 0,8 – 1 m ? Greenland 0.6 mm yr-1 Other ice masses 0.8 mm yr-1 Thermal expansion of oceans 1.6 mm yr-1
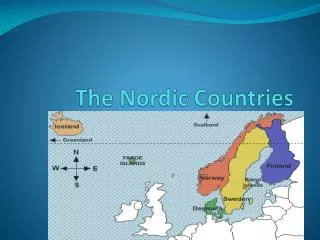
Glacierscover 11% of Iceland, 11,000 km2, 3,600 km3 Estimatedaverageannualmassbalance, mw.e. a-1 Red: DDEM Black: annualmassbalancemeasurements
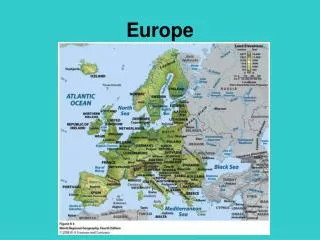
Iceland at theboundarybetweenpolar and mid-latitudeatmosphericcirculationcells in thewesterlies and confluence of warm and coldseacurrents Sea surface temperature, oC Inter-annualvariabilityin massbalance maybeexpected in theNorthAtlanticarea forcedbyfluctuations in atmosphericcirculation and oceancurrents
Airtemperature Precipitation Seatemperature Massbalance± 0.15mw.e. a-1 Nearzeromassbalance 1980-1995 1900
Generalmass loss reflects: Highersummer temperature Longermelting seasons Warmwintersreducingproportion of precipitation falling as snow Earlierexposure of lowalbedoglacierice (radiation:3/4 of melt energy) Higherseatemperatures Fluctuations relate to: Coldsprings, lateexposureof lowalbedoglacierice Snowfallduringsummers Depositionof tephraaerosols Maritimeclimateoutletsdecreasingfasterthaninland
Annual total mass loss of Iceland‘s glaciers 1995-2011 2.7 to 25.3 ± 1.5 Gt a-1 -0.2 to -2.2 ± 0.15mw.e. a-1 Average 9.5 ± 1.5 Gt a-1 (0.03 mm a-1 SLE)
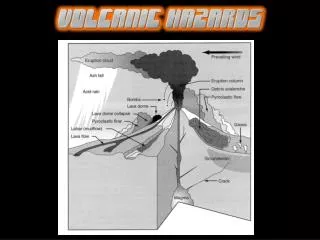
Annual total mass loss of Iceland‘s glaciers Total ice melt 1995-2010: 85% directlyclimaterelated 13% (20 Gt) duetolowering of albedobytephraaerosols < 3% meltedbygeothermalheat 2% meltedbyvolcaniceruptions
Observed summer temperature and winterprecipitation Observedseatemperature Observedmassbalance Modelledmassbalance
Coupledmass-balance-ice-flowmodel Mass balance related to climate through mass balance measurements and meteorological observations Accumulation area Firnline Ice flow Ablation area Runoff
Mass-balanceevolutionsimulated • with a coupledmass-balance-ice-flowmodel • forcedbydailymeantemperaturerecordsand accumulatedprecipitation • fromnearbymeteorologicalstations and • calibratedwithseasonalstakemeasurements of winter and summer massbalance winter DDEM summer • Distributedsnowaccumulationand temperature-indexmelt (positivedegree-daymodel, PDD)
Climatechangescenario (A1B) for Icelandichighland Future 0.2 °C/decade 3.4 mm/decade. Predictedglacierresponse
Interannualvariationsin mass balancemaybeexpected in theNorthAtlanticarea, forcedbyfluctuations in atmosphericcirculation and oceancurrents, superimposedontheprojectedtrend of increasinglynegativeglaciermassbalance Glaciers in a cold temperate climate Iceland oC Sea surface temperature
Predictedresponsetothe A1B climatechangescenario Mass balance model coupled with a ice-flow model (given geometry) Model responses shown for threeIcelandicicecaps: Vatnajökull, Langjökull and Hofsjökull Year 2060: sea level rise 0,06 mm/a Note: Volumes and areas are normalized to present day values Specific runoff is from the present day glacier covered area
Mass balance modelling Mass balance related to climate Meteorological observations
Hlutur jökla orðinn meiri en útþensla hafs 2005-2010 3.3 mm ár-1 3.3 +/- 0.4 frá 1993-2009 Suðurskautslandið0.3 mm ár-1 Grænlandsjökull 0.6 mm ár-1 ? Jöklar utan heimskauta 0.8 mm ár-1 Varmaútþensla 1.6 mm ár-1