Download
1 / 23
260 likes | 486 Views
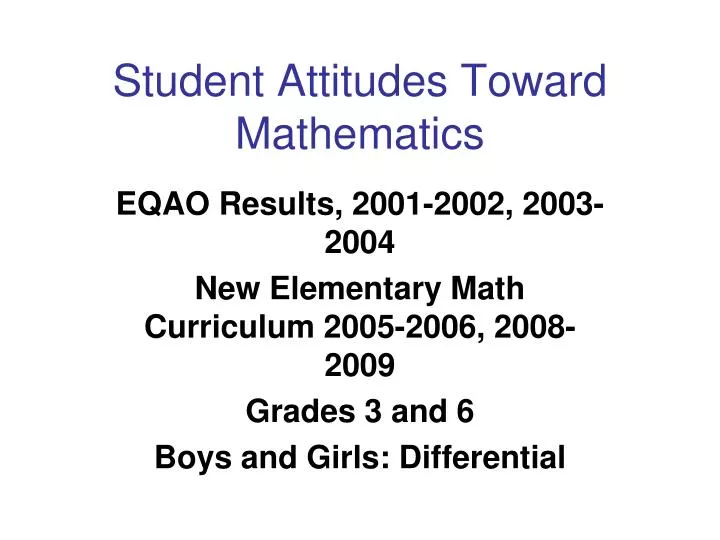
Student Attitudes Toward Mathematics. EQAO Results, 2001-2002, 2003-2004 New Elementary Math Curriculum 2005-2006, 2008-2009 Grades 3 and 6 Boys and Girls: Differential. EQAO Results, 2001-2002 Grades 3 and 6. Indicate they are good at mathematics:

E N D
Student Attitudes Toward Mathematics EQAO Results, 2001-2002, 2003-2004 New Elementary Math Curriculum 2005-2006, 2008-2009 Grades 3 and 6 Boys and Girls: Differential
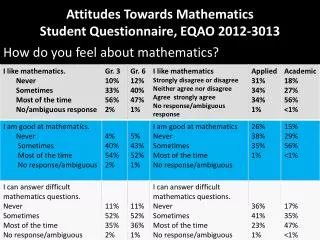
EQAO Results, 2001-2002Grades 3 and 6 • Indicate they are good at mathematics: • Grade 3: Boys (61%) 17 percent higher than girls (44%) • Grade 6: Boys (58%) 19 percent higher than girls (39%) • Indicate they like mathematics: • Grade 3: Boys (66%) 9 percent higher than girls (57%) • Grade 6: Boys (56%) 13 percent higher than girls (43%)
EQAO Results, 2001-2002Grades 3 and 6 • Indicate they that they do mathematics outside of school: • Grade 3: Boys (39%) 2 percent lower than girls (41%) • Grade 6: Boys (34%) 6 percent higher than girls (28%)
EQAO Results, 2003-2004Grades 3 and 6 • Indicate they are good at mathematics: • Grade 3: Boys (62%) 17 percent higher than girls (45%) • Grade 6: Boys (60%) 19 percent higher than girls (41%) • Indicate they like mathematics: • Grade 3: Boys (64%) 8 percent higher than girls (56%) • Grade 6: Boys (55%) 15 percent higher than girls (40%)
EQAO Results, 2003-2004Grades 3 and 6 • Indicate that they do mathematics outside of school: • Grade 3: Boys (38%) the same as girls (38%) • Grade 6: Boys (43%) 7 percent higher than girls (36%)
EQAO Results, 2005-2006Grades 3 and 6Revised Mathematics Curriculum • Indicate they are good at mathematics: • Grade 3: Boys (61%) 15 percent higher than girls (46%) • Grade 6: Boys (58%) 19 percent higher than girls (39%) • Indicate they like mathematics: • Grade 3: Boys (62%) 6 percent higher than girls (56%) • Grade 6: Boys (53%) 15 percent higher than girls (38%)
EQAO Results, 2005-2006Grades 3 and 6 • Indicate that they do mathematics outside of school: • Grade 3: Boys (36%) the same as girls (36%) • Grade 6: Boys (41%) 6 percent higher than girls (35%)
EQAO Results, 2008-2009Grades 3 and 6 • Indicate they are good at mathematics: • Grade 3: Boys (60%) 14 percent higher than girls (46%) • Grade 6: Boys (57%) 17 percent higher than girls (40%) • Indicate they like mathematics: • Grade 3: Boys (61%) 4 percent higher than girls (57%) • Grade 6: Boys (51%) 13 percent higher than girls (38%)
EQAO Results, 2008-2009Grades 3 and 6 • Indicate that they do mathematics outside of school: • Grade 3: Boys (32%) 1 percent higher than girls (31%) • Grade 6: Boys (38%) 7 percent higher than girls (31%)
For grade 3 students, opinions haven’t really changed since 2001-2002, in regards to how good students think they are in mathematics. There are quite significant differences, however, between ‘males opinions’ and ‘females opinions.’ Year
For grade 3 students, again, not much change since 2001-2002 has occurred in opinions about interest in mathematics. Students in 2008-2009 still like mathematics, about the same as students in 2001-2002. Gender differences are apparent, but not by much. Generally speaking, in regards to this graph, males like mathematics more than females. Year
For grade 3 students there has been a slight decline in the percent who use mathematics to solve problems outside of the classroom. The gender differences, again, are not significant, and in 2003-2004 and 2005-2006, they are the same. Reasons for declining numbers in this area could be, but aren’t limited to, lack of motivation, less homework assigned, busy parents, more television, videogames, etc. available to students that take away from homework time. Year
Over the years, grade 6 students’ opinions of how good they are in mathematics have started to decline. It is hard to say why these declines are occurring, however, it does give us insight into how we, as future educators, need to change our methods for teaching mathematics so that students have more confidence in themselves. When we look at the gender differences, both males and females have the same opinions of how good they are at math, with the exception of 2001-2002 where more females than males thought they were good at math; and 2008-2009 where slightly more males than females thought they were good at math. Graph Needs Revising Year
There have been slight declines in the percentage of grade 6 students who like mathematics, but not by much. Generally speaking, the same amount of students who take the EQAO standardized tests like mathematics now, as compared to students in 2001-2002. There are slight gender differences, as well, in regards to liking mathematics; males tend to like mathematics more than females. Year
Since 2001-2002,there has been a slight decline in the percent of grade 6 students who practice mathematics outside of their school environments. There could be various reasons for this, however, the most common reason would most likely be the availability of television, videogames, media, etc. These resources conflict with students’ interest, and willingness, to practice mathematics at home. Another reason could be parents’ time management and the pressures that working all day and having to come home and take care of things there present. The list goes on in regards to reasons why students are less likely to practice mathematics outside of school. Again, not many gender differences. Year