Download
1 / 42
420 likes | 580 Views
7 th Avenue and 7 th Street Reverse Lanes. Overview Operational Analysis Public Opinion. Reverse Lane Public Hearing Sunnyslope Community Center October 6, 2010 Kerry Wilcoxon, P.E. Reverse Lane Overview. Reverse Lane Study Technical Analysis by Street Transportation Current studies

E N D
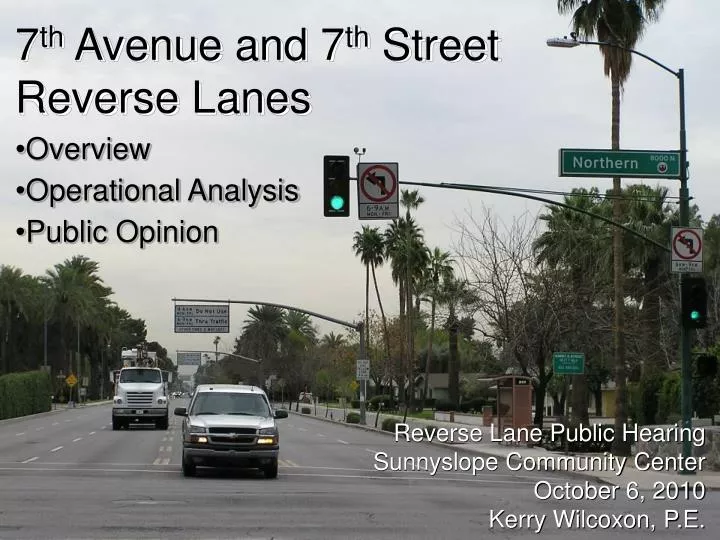
7th Avenue and 7th Street Reverse Lanes • Overview • Operational Analysis • Public Opinion Reverse Lane Public Hearing Sunnyslope Community Center October 6, 2010 Kerry Wilcoxon, P.E.
Reverse Lane Overview • Reverse Lane Study • Technical Analysis by Street Transportation • Current studies • Quality-of-life analysis by ASU PURL • Including differences among neighborhoods • Operational Alternatives
Background • Mayor Hance identified traffic congestion as #1 concern for Phoenicians in 1979 • Mayor/Council directed staff to develop low-cost solutions • Widening or building new streets was not an option • Reverse lane selected to accommodate growth in Central Core
7th Avenue &7th Street Central Phoenix 7th Street started in 1982 • Adams to Dunlap Ave • Now McDowell to Dunlap (7 miles) 7th Avenue started in 1979 • McDowell to Northern Ave. (6 miles)
7TH ST 7TH AVE Without Reverse Lanes 2 Lanes SB each street 650 Vehicles/Hour/Lane Without Reverse Lanes 3 Lanes NB each street 650 Vehicles/Hour/Lane
7TH ST 7TH AVE With Reverse Lanes 3 Lanes SB 50% Capacity Increase 750 Vehicles/Hour/Lane With Reverse Lanes 4 Lanes NB 33% Capacity Increase 750 Vehicles/Hour/Lane
Original Issues • Dilemma: • Benefit – Increased north/south traffic flow • Detriment – Limited turning movements • Concerns: • Neighborhood cut-through • Safety • Access (to businesses and neighborhoods) • Questions: Are they still needed? If yes, can they work better? If no, what are the consequences (costs) of removal?
Study Approach Engineering • Street Transportation Department • Review current conditions • Forecast future demand Public Perception • Phoenix Urban Research Lab (PURL) ASU • Survey stakeholders
Street Transportation Dept • Crash Rates • Comparison – 7th Ave to 19th Ave 7th St to 16th St • Lane Utilization • Percentage of reverse lane utilization • Traffic speeds • Capacity Analyses • Traffic flow modeling
Crash Rate Comparison • Methodology • Study Period 2003-2005 (pre-LRT) • Streets Examined - 19th Ave, 7th Ave, 7th St, 16th St • Crashes involving at least one north/south vehicle • Calculation Crash Rate = Crashes by Hours Hourly Traffic Volumes x Length
Crash Rates AM Reverse Lane Hours 7th St 7th Av 16th St 19th Av Northern Av Glendale Av HI Bethany Home Rd Segment Camelback Rd Intersection Indian School Rd Thomas Rd McDowell Rd
7th St 7th Av 16th St 19th Av Northern Av Glendale Av Bethany Home Rd Camelback Rd Indian School Rd Thomas Rd McDowell Rd Crash Rates PM Reverse Lane Hours HI Segment Intersection
7th St 7th Av 16th St 19th Av Northern Av Glendale Av Bethany Home Rd Camelback Rd Indian School Rd Thomas Rd McDowell Rd Crash Rates Non-Reverse Lane Hours HI Segment Intersection
Common Type of Crashes2001-2005 Most Common:All Four Streets Rear End Most Severe: 19th Av Angle 7th Av Angle 7th St Angle/Left Turn 16th St Left Turn
Annualized Head-On Crashes2001-2005 16th St – 5.4 crashes/year 7th St – 4.4 19th Ave – 3.4 7th Ave – 1.8
Annualized Pedestrian Crashes2001-2005 19th Ave – 11.4 crashes/year 7th St – 11.2 16th St – 10.4 7th Ave – 6.0
27% N/A NORTHERN AV NORTHERN AV 25% GLENDALE AV GLENDALE AV 24% BETHANY HOME RD BETHANY HOME RD 28% 7TH ST 7TH AV CAMELBACK RD CAMELBACK RD 27% 23% INDIAN SCHOOL RD INDIAN SCHOOL RD 25% 25% THOMAS RD THOMAS RD 23% 18% 2007 Reverse Lane UtilizationAM Peak Hours 30% N 30% 26%
16% N/A 2007Reverse Lane UtilizationPM Peak Hours NORTHERN AV NORTHERN AV 18% 14% N GLENDALE AV GLENDALE AV 15% N/A BETHANY HOME RD BETHANY HOME RD 14% 17% 7TH ST 7TH AV CAMELBACK RD CAMELBACK RD 15% 12% INDIAN SCHOOL RD INDIAN SCHOOL RD 11% 9% THOMAS RD THOMAS RD 9% 6%
CurrentAverageSpeedsSouthbound AM NORTHERN AV NORTHERN AV 44 MPH 44 MPH 7TH AVE 7TH ST GLENDALE AV GLENDALE AV BETHANY HOME RD BETHANY HOME RD 41 MPH 41 MPH CAMELBACK RD CAMELBACK RD 38 MPH 40 MPH INDIAN SCHOOL RD INDIAN SCHOOL RD THOMAS RD THOMAS RD 42 MPH N
NORTHERN AV NORTHERN AV 45 MPH 44 MPH 7TH AVE 7TH ST GLENDALE AV GLENDALE AV CurrentAverageSpeedsNorthbound PM BETHANY HOME RD BETHANY HOME RD 43 MPH 41 MPH CAMELBACK RD 41 MPH CAMELBACK RD 40 MPH INDIAN SCHOOL RD INDIAN SCHOOL RD 41 MPH 40 MPH THOMAS RD THOMAS RD
Capacity Analysis • Traffic Modeling • Existing reverse lanes vs. Hypothetical conditions • Input • Traffic Volume • Lane Configuration • Signal Timing • Output • Travel Time Comparison
Morning Peak Hour 7:15 – 8:15 Afternoon Peak Hour 4:30 – 5:30 Travel Times - 7th AvenueMcDowell to Northern - Actual and Predicted 29 19 15 11 Predicted w/o Reverse Lane Predicted w/o Reverse Lane Actual Actual
Morning Peak Hour 7:15 – 8:15 Afternoon Peak Hour 4:30 – 5:30 Travel Times - 7th Street McDowell to Northern - Actual and Predicted 44 30 25 20 Predicted w/o Reverse Lane Predicted w/o Reverse Lane Actual Actual
Travel Time ComparisonMorning Peak HourNorthern to McDowell Alignments 25 min. 15 min. 14 min. 11 min. 10 min. SR-51 7th St 7th Av 16th St I-17 Morning Peak Hour 7:15 – 8:15
Travel Time ComparisonAfternoon Peak HourMcDowell to Northern Alignments 20 min. 15 min. 15 min. 12 min. 11 min. SR-51 16th St 7th St 7th Av I-17 Afternoon Peak Hour 4:30 – 5:30
Estimated Future Traffic - 2030(thousands of vehicles per day) Source: City of Phoenix Traffic Volume Map Source: MAG Model
Reverse Lane Users(Driver Home Zip Code) Union Hills Dr Glendale Av
Neighborhood Cut Thru Analysis Current: Left-turn generated cut-thru Cause: Left-turn restrictions at signals Occurs: Downstream of signals • Primarily left turns into neighborhoods Predicted: Congestion generated cut-thru Cause: Low capacity at signals Occurs: Upstream and downstream of signals • Includes left and right turns into neighborhoods North
Traffic CountsDuring Recession • 14% reduction in Average Daily Traffic (ADT) at city-wide count stations from 2005 to 2009 • 30% reduction in ADT on the reverse lane streets from 2005 to 2009
Engineering Findings • Traffic safety on 7th Avenue and 7th Street similar to other arterial streets • Reverse lanes carry a substantial amount of rush hour traffic • Removal would result in loss of capacity with same demand • Neighborhood cut-thru routes may shift
ASU Phoenix Urban Research Lab (PURL) – Stakeholder Survey Goal: Determine how stakeholders view the lanes and how they would change them (improve, eliminate, preserve)? Process • Identify stakeholders (drivers, peds, bicyclists, residents, business owners, etc.) • Conduct sample-based surveys of stakeholders • Conduct focus groups of stakeholder groups • Analyze survey and focus group responses
Quality-of-Life Study ResultsCentral Phoenix Neighborhoods • Very few satisfied with business-as-usual • Main quality-of-life concerns: • Reverse lanes inhibit access • Most feel lanes are unsafe • Driver confusion • Would recommend: • Keep the lanes & add electronic signage • Eliminate the reverse lane on 7th Street/7th Avenue • Little support to keep lanes with no changes
Quality-of-Life Study ResultsNorth Central Neighborhoods • More satisfied with operation than other stakeholders • More than 50% say: • Lanes are safe and reduce travel time • Reverse lane signs are understandable • Would recommend: • Enforcement and more left turn opportunities • Sign upgrades e.g., electronic signs
Operational Alternatives Scenarios: • Maintain Reverse Lanes as is • Permanently Remove Reverse Lanes • Maintain Reverse Lane; • add flashing lights to existing signs • add electronic lane control beacons • Temporarily remove Reverse Lanes as test
Scenario 1 – Keep Reverse LanesNo Change of Operation Maintain existing reverse lane operation - Continue to optimize • Continue enforcement Estimated Cost: $0
Scenario 2 –Permanently remove Reverse Lane operation Remove reverse lanes on both streets - Remove existing signs and mast arms - Install new turn arrows at major intersections - Re-evaluate signal timing - Public education campaign Estimated Total Cost: Without sign pole removal $630,000 With sign pole removal $955,000
Scenario 3a – Keep Reverse LanesAdd flashing lights to existing signs Install flashing lights to existing overhead signs • Supply power to existing sign poles • Install flashing beacons and wireless communication equipment • Public education campaign Estimated Total Cost: $3,850,000
Scenario 3b – Keep Reverse LanesAdd electric lane control signals Install additional new red X – Green Circle lane control signals, additional poles and new signs • Install additional signs and sign posts • Supply power to mast arms • Install supporting control equipment • Public education campaign Estimated Total Cost: $24,510,000
Scenario 4 –Temporarily remove Reverse Lane as test Remove reverse lanes on 7th Avenue or 7th Street - Remove existing signs - Public education campaign Estimated Total Cost: 7th Avenue: $65,000 7th Street: $70,000
Ad-Hoc Committee Schedule • Aug - Sept Task Force Meetings • Sept - Oct Public Meetings • Reverse lane survey on-line (until 10/31/2010) • November Task Force Meeting • Develop Recommendations • December Presentation to City Council Reverse Lane Survey: http://lists.phoenix.gov/subscribe/survey?f=217
Questions?Kerry Wilcoxon602-262-4613kerry.wilcoxon@phoenix.govreverse.lanes@phoenix.gov