1 / 1

Log (sec)

Log (sec). Log (sec). Log (sec). Log (sec). Log (sec). Log (sec). Log (sec).

carlyn
Download Presentation

Log (sec)

An Image/Link below is provided (as is) to download presentation Download Policy: Content on the Website is provided to you AS IS for your information and personal use and may not be sold / licensed / shared on other websites without getting consent from its author. Content is provided to you AS IS for your information and personal use only. Download presentation by click this link. While downloading, if for some reason you are not able to download a presentation, the publisher may have deleted the file from their server. During download, if you can't get a presentation, the file might be deleted by the publisher.

E N D

Presentation Transcript


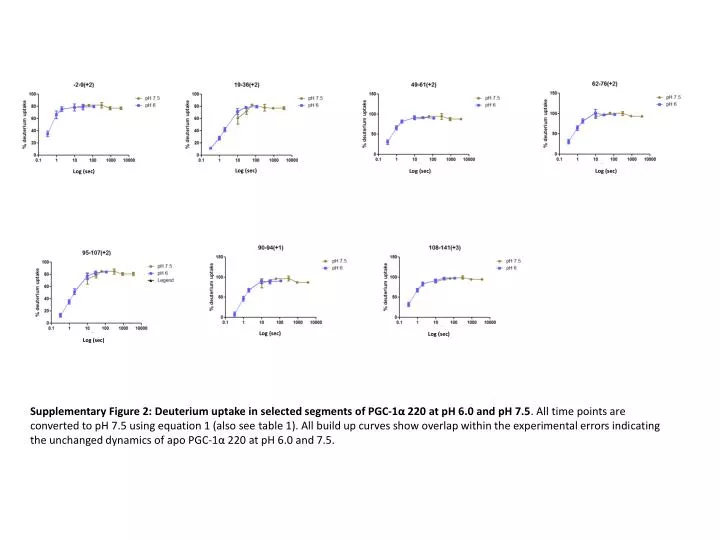
  1. Log (sec) Log (sec) Log (sec) Log (sec) Log (sec) Log (sec) Log (sec) Supplementary Figure 2: Deuterium uptake in selected segments of PGC-1α 220 at pH 6.0 and pH 7.5. All time points are converted to pH 7.5 using equation 1 (also see table 1). All build up curves show overlap within the experimental errors indicating the unchanged dynamics of apo PGC-1α 220 at pH 6.0 and 7.5.

More Related