Download
1 / 38
380 likes | 389 Views
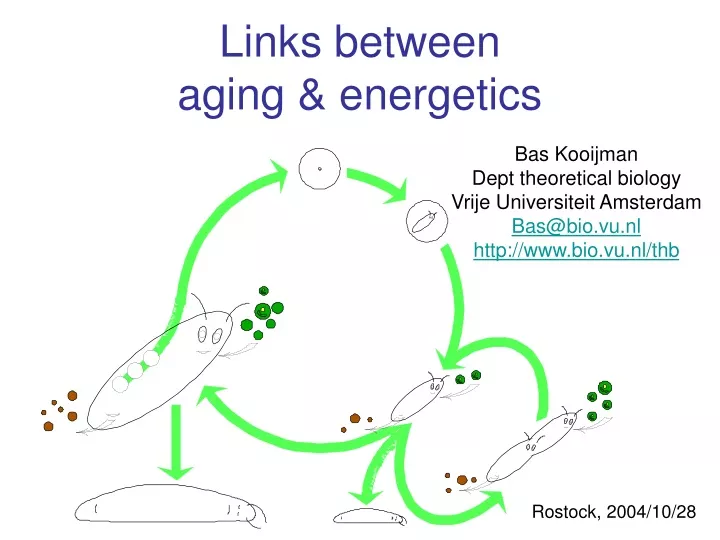
Links between aging & energetics. Bas Kooijman Dept theoretical biology Vrije Universiteit Amsterdam Bas@bio.vu.nl http://www.bio.vu.nl/thb. Rostock, 2004/10/28. Contents. DEB theory introduction metabolic rate Effects of toxicants sublethal effects lethal effects

E N D
Links between aging & energetics Bas Kooijman Dept theoretical biology Vrije Universiteit Amsterdam Bas@bio.vu.nl http://www.bio.vu.nl/thb Rostock, 2004/10/28
Contents • DEB theory • introduction • metabolic rate • Effects of toxicants • sublethal effects • lethal effects • Effects of free radicals • sleep • tumour induction & growth • Aging • dilution by growth • damage amplification • effects of caloric restriction Rostock, 2004/10/28
Dynamic Energy Budget theoryfor metabolic organisation • Uptake of substrates (nutrients, light, food) • by organisms and their use (maintenance, growth, • development, reproduction) • First principles, quantitative, axiomatic set up • Aim: Biological equivalent of Theoretical Physics • Primary target: the individual with consequences for • sub-organismal organization • supra-organismal organization • Relationships between levels of organisation • Many popular empirical models are special cases of DEB
Space-time scales Each process has its characteristic domain of space-time scales system earth space ecosystem population When changing the space-time scale, new processes will become important other will become less important Individuals are special because of straightforward energy/mass balances individual cell time molecule
DEB theory is axiomatic, based on mechanisms not meant to glue empirical models Since many empirical models turn out to be special cases of DEB theory the data behind these models support DEB theory This makes DEB theory very well tested against data Empirical special cases of DEB
Not age, but size: :These gouramis are from the same nest, they have the same age and lived in the same tankSocial interaction during feeding caused the huge size differenceAge-based models for growth are bound to fail; growth depends on food intake Trichopsis vittatus
Some DEB pillars • life cycle perspective of individual as primary target • embryo, juvenile, adult (levels in metabolic organization) • life as coupled chemical transformations (reserve & structure) • time, energy & mass balances • surface area/ volume relationships (spatial structure & transport) • homeostasis (stoichiometric constraints via Synthesizing Units) • syntrophy (basis for symbioses, evolutionary perspective) • intensive/extensive parameters: body size scaling
Biomass: reserve(s) + structure(s) • Reserve(s), structure(s): generalized compounds, • mixtures of proteins, lipids, carbohydrates: fixed composition • Compounds in • reserve(s): equal turnover times, no maintenance costs • structure: unequal turnover times, maintenance costs • Reasons to delineate reserve, distinct from structure • metabolic memory • explanation of respiration patterns (freshly laid eggs don’t respire) • biomass composition depends on growth rate • fluxes are linear sums of assimilation, dissipation and growth • basis of method of indirect calorimetry • explanation of inter-species body size scaling relationships
defecation feeding food faeces assimilation reserve somatic maintenance maturity maintenance 1- maturation reproduction growth maturity offspring structure Basic DEB scheme
Metabolic rate • Usually quantified in three different ways • consumption of dioxygen • production of carbon dioxide • dissipation of heat • DEB theory: These fluxes are weighted sums of • assimilation • maintenance • growth • Weight coefficients might differ • Not constant, depends on size & feeding conditions
Metabolic rate slope = 1 Log metabolic rate, w O2 consumption, l/h 2 curves fitted: endotherms 0.0226 L2 + 0.0185 L3 0.0516 L2.44 ectotherms slope = 2/3 unicellulars Log weight, g Length, cm Intra-species Inter-species (Daphnia pulex)
Scaling of metabolic rate Respiration: contributions from growth and maintenance Weight: contributions from structure and reserve Structure ; = length; endotherms
assimilation maintenance costs defecation feeding food faeces growth costs assimilation reproduction costs reserve hazard to embryo somatic maintenance maturity maintenance 1- maturation reproduction growth maturity offspring structure Modes of action of toxicants Lethal effects: hazard rate Mode of action affects translation to pop level
Toxic effect on survival Effect of Dieldrin on survival of Poecilia One-compartment kinetics Hazard rate is linear in internal concentration killing rate 0.038 l g-1 d-1 elimination rate 0.712 d-1 NEC 4.49 g l-1
Many factors contribute to hazard • genetic factors (apoptosis) • starvation (diet deficiencies, type II diabetes) • environmental factors (physical, chemical, toxicants) • pathogens (disease) • accidents (predation) • aging
Free radicals Sleep Amount of sleep No thermo-regulation during REM sleep Dolphins: no REM sleep opossum ferret cat dog man 10log REM sleep, h/d elephant 10log body weight, kg Siegel, J. M. 2001 The REM sleep-memory consolidation hypothesis Science294: 1058-1063
Free radicals Tumour induction Tumour induction is linear in conc free radicals & other tumour inducing compounds It can occur via genotoxic effect (damage of genome) non-genotic effects (effects on cell-to-cell signalling) No Effect Concentration might be positive
Competitive tumour growth Allocation to tumour relative maint workload defecation feeding food faeces assimilation Isomorphy: is constant Tumour tissue: low spec growth costs low spec maint costs reserve somatic maintenance maturity maintenance 1- maint maturation reproduction u 1-u growth maturity offspring Van Leeuwen et al., 2003 The embedded tumour: host physiology is important for the evaluation of tumour growth. British J Cancer 89, 2254-2268 structure tumour
Tumor growth DEB theory • The shape of the tumor growth curve is not assumed a priori, • and is very flexible, depending on parameter values • The model predicts that, in general, • tumors develop faster in young than in old hosts • According to the model, tumors grow slower in • calorically restricted animals than in ad libitum fed animals. • The effect of CR on tumor growth fades away during long-term CR • The model explains why tumor-mediated body-weight loss • is often more dramatic than expected
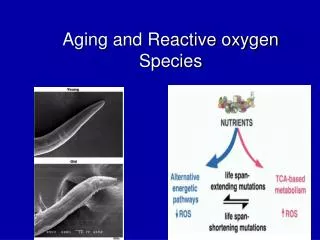
Free radicals Aging • Aging results from damage by Reactive Oxygen Species (ROS) Gerschman 1954 • link with DEB model via dioxygen consumption & metabolic activity • Dioxygen use in association with assimilation is not included • because of more local occurrence in organism • Its affects are binary in unicellulars, and gradual in multicellulars • age-affected cells no longer divide • Typical aging only occurs in multicellulars with irreversible cell differentiation • that have post-mitotic tissues • Empirical evidence points to an acceleration mechanism • damage inducing compounds • amplification of existing damage • Some chemical compounds (e.g. RNS) and -radiation can stimulate aging
Aging: Damage induction • Hazard rate due to aging damage density: • Damage forms damage inducing compounds: • Damage inducing compounds form catabolic rate: • i.e. dioxygen consumption excluding contributions from assimilation • Result for • If mean life span >> growth period: Weibull’s model • Problems: • bad fit with endotherm data, but good fit with ectotherm data • effect of increase in food uptake balanced by dilution by growth time hazard rate survival prob ageing acceleration maintenance rate coeff structural volume
Aging & Growth length, mm survival probability Lymnaea stagnalis age, d age, d DEB aging model: kM = 0.073 d-1; ha = 2.53 10-6 d-2 Weibull model: shape par = 3.1 Data: Slob & Janse 1988 Von Bertalanffy model: rB = 0.015 d-1 L = 35 mm
Aging in adult insects survival based on observed reproduction No growth surviving number # of eggs/beetle, d-1 initial random mort surviving number age after eclosion, d age after eclosion, d age after eclosion, d Weibull model Data: Ernsting & Isaaks, 1991 Data: Rose 1984 High food, 20/10 °C 0.63 a-2 High food, 10 °C 0.547 a-2 Low food, 20/10 °C 0.374 a-2 Notiophilus biguttatus Drosophila melanogaster
Aging & Sex Daphnia magna female length, mm Hazard rate, d-1 male age, d age, d Conclusion: differences in aging are due to differences in energetics Common aging acceleration 2.587 10-5 d-2 Data: MacArthur & Baillie 1929
RNS Aging Asplanchna girodi Hazard rate, d-1 Aging acceleration, 0.001 d-2 Ultimate volume 10-12 m3 age, d age, d Food levels: 20, 30, 60, 120, 240 paramecia d-1 rotifer-1 Aging acceleration linear in food level Data: Robertson & Salt 1981 Suggestion: Paramecia are rich in NO32- & NO22-from lettuce, which enhances aging
-Radiation ROS Aging Deinococcus radiodurans (Deinobacteria, Hadobacteria) Very resistant against -radiation by accumulation of Mn2+ which neutralizes ROS that is formed One cell from a tetrad
Stringent response Aging rm: max spec growth rate kM: maintenance rate coefficient ha: aging rate e: scaled reserve density g: investment ratio Fraction of dead cells Stringent response occurs in bacteria at low substrate concentration Substantial change in physiology (e.g. accumulation of ppGpp) Suggestion: Result of aging in bacteria Low substrate low growth long division intervals Scaled throughput rate of chemostat
Aging in humans q = 0.988 h = 0.0013 a-1 hW = 0.01275 a-1 = 6.8 Surviving fraction Aging accelerates in endotherms Not captured by damage induction model age, d Data from Elandt-Johnson & Johnson 1980
Lung cancer in mice Weibull model fitted: High adult incidence rate Following low rate in juveniles Female mice 200ppm butadiene (KM-adjusted data) lung cancer free probability Toxicology and carcinogenesis studies of 1,3-butadiene in B6C3F1 mice National Toxicology Program (USA) 1993
Amplification mechanisms 1) Affected mitochondria produce more ROS Weindruch R 1996 Caloric restriction and aging. Scientific American 231, 46-52. 2) Affected mitochondria grow and degrade at different rates • Kowald A 2001 The mitochondrial theory of aging, Biological Signals & Receptors 10, 162-175. • Kowald A & Kirkwood TBL 2000 Accumulation of defective mitochondria through delayed degradation of damaged • organelles and its possible role in the aging of post-mitotic cells. Journal of Theoretical Biology 202, 145-160.
Aging: Damage amplification Hazard rate due to aging damage density Damage forms catabolic rate + amplification rate Specific amplification rate is linear in catabolic rate Result for If mean life span >> growth period: Gompertz’s model Van Leeuwen et al 2002 A mathematical model that accounts for the caloric restriction on body weight and longivety Biogerontology3: 373-381 ROS import spec rate damaged mitoch growth r ROS feedback vol
Food intake Surface area This assumption in DEB theory is usually realistic weight1/3, g1/3 feeding rate, g/d males females age, d age, d Parus atricapillus Data from Kluyver 1961 & Grundel 1987
Food intake is constant in laboratory rodents Probably as a result of experimental conditions males females males females Carcinogenicity study with B[a]P in rats Kroese et al., (2001) RIVM technical report nr. 658603 010
Aging: Damage amplification Feeding level: 1, 0.75, 0.44 times ad libitum Caloric restriction extends life span weight, g srvivors, % time, d time, d Data: Weindruch et al, 1986 specific metabolic rate Van Leeuwen et al 2002 A mathematical model that accounts for the caloric restriction on body weight and longivety Biogerontology3: 373-381
Aging DEB theory • The aging process can be modelled within the DEB framework • as a result of internally produced ROS that affects the hazard rate • no max life span exists; consistency with lethal effects of toxicants • The model is able to predict differences in life expectancy • on the basis of differences in food intake • The model predicts CR-induced decrease in • mass-adjusted energy expenditure to disappear with long-term CR • The model provides a physiologically-based interpretation • of the Gompertz parameters • The model suggests that two essential feed-back processes take place
Aging: Function • Observation: • Aging related hazard rate • remains low during embryonic and juvenile stages • becomes high at start of reproduction • Suggestion: • Organisms • decrease protection level in adult stage • use ROS to create genetic diversity among gametes • use genetic diversity for adaptation to changing environment • efficient defence (peroxidase dismutase) or repair systems • or reduced ROS production can increase life span, • but reduce genome diversity
Aging: Open questions • Damage Induction (DI) Damage Amplification (DA) model • Should 1-par DI-model always be replaced by 3-par DA model? • Can DI-model approximate DA-model under certain conditions? • How important is dilution by growth? • Is it possible to improve the models, • while preserving simplicity & generality • workload model for synthesis of mitochondria • Is dioxygen consumption that is linked to assimilation of importance? • Should/can cause of death by aging be specified more explicitly? • tumours, weakening of defense systems (immune system)
DEB tele-course 2005 Feb – April 2005, 10 weeks, 200 h no financial costs http://www.bio.vu.nl/thb/deb/course/ Download slides of Rostock lecture by Bas Kooijman http://www.bio.vu.nl/thb/users/bas/lectures/