Download
1 / 7
70 likes | 233 Views
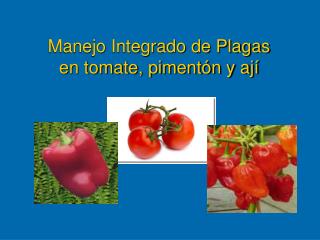
Sistema de Cultivo, Áre as Estimadas, Rendimientos , Producción y Destino. (1997/98). Sistema Cultivo. Á reas Estimadas. Rendimientos. Producción. Destino. A campo. 6000 ha. 30.000 kg/ha. 180.000 tn. In dus tria. A campo. 13.000 ha. 4 5.000 kg/ha.

E N D
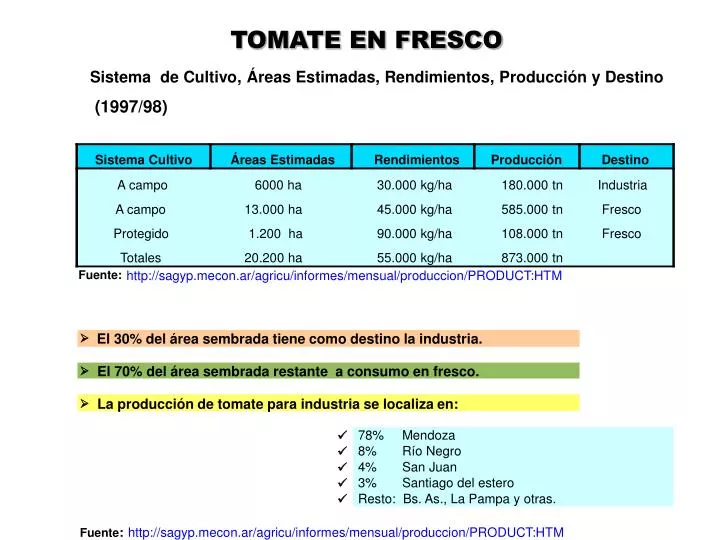
Sistema de Cultivo, Áreas Estimadas, Rendimientos, Producción y Destino (1997/98) Sistema Cultivo Áreas Estimadas Rendimientos Producción Destino A campo 6000 ha 30.000 kg/ha 180.000 tn Industria A campo 13.000 ha 45.000 kg/ha 585.000 tn Fresco Protegido 1.200 ha 90.000 kg/ha 108.000 tn Fresco Totales 20.200 ha 55.000 kg/ha 873.000 tn Fuente: http://sagyp.mecon.ar/agricu/informes/mensual/produccion/PRODUCT:HTM El 30% del área sembrada tiene como destino la industria. Ø El 70% del área sembrada restante a consumo en fresco. Ø La producción de tomate para industria se localiza en: Ø 78% Mendoza ü 8% Río Negro ü 4% San Juan ü 3% Santiago del estero ü Resto: Bs. As., La Pampa y otras. ü Fuente: http://sagyp.mecon.ar/agricu/informes/mensual/produccion/PRODUCT:HTM TOMATE EN FRESCO
TOMATE: PRODUCCION (tn) Y SUPERFICIE PLANTADA (ha) EN ARGENTINA 950000 40000 900000 37500 850000 35000 800000 32500 750000 30000 700000 27500 650000 600000 tn ha 25000 550000 22500 500000 20000 450000 17500 400000 15000 350000 300000 12500 250000 10000 200000 7500 150000 5000 100000 2500 50000 0 0 1980 1981 1982 1991 1993 1994 1995 1996 1983 1984 1985 1986 1987 1988 1989 1990 1992 1997 1998 1999 2000
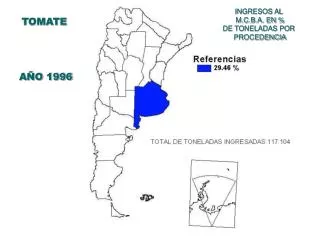
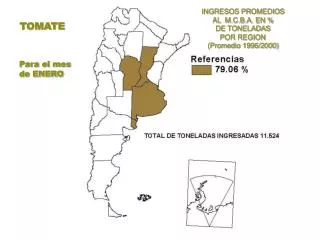
TOMATE REGIONES PRODUCTORAS
TOMATE REGIONES PRODUCTORAS
TOMATE REGIONES PRODUCTORAS
TOMATE REGIONES PRODUCTORAS
TOMATE REGIONES PRODUCTORAS