Download
1 / 15
160 likes | 409 Views
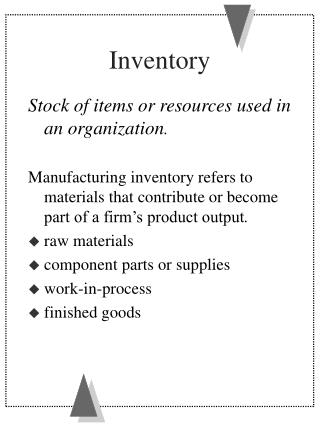
INVENTORY. Based on slides for Chase Acquilano and Jacobs, Operations Management, McGraw-Hill. Inventory System. What is inventory? the stock of any item or resource used in an organization and can include: raw materials, finished products, component parts, supplies, and work-in-process

E N D
INVENTORY Based on slides for Chase Acquilano and Jacobs, Operations Management, McGraw-Hill
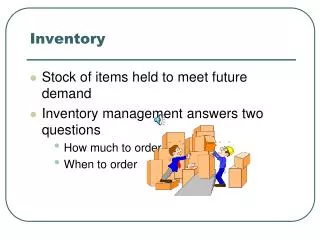
Inventory System • What is inventory? • the stock of any item or resource used in an organization and can include: raw materials, finished products, component parts, supplies, and work-in-process • What is an inventory system? • the set of policies and controls that monitor levels of inventory and determines what levels should be maintained, when stock should be replenished, and how large orders should be • What are some purposes of inventory?
Independent vs. Dependent Demand Independent Demand (Demand for the final end-product or demand not related to other items) Dependent Demand (Derived demand items for component parts, subassemblies, raw materials, etc) Finished product E(1) Component parts
Independent Demand Inventory • Issues: • How much to order? • When to order? • Some Models: • Single period (Newsvendor) • Order quantity and order level • Fixed order period
Inventory Costs • Holding (or carrying) costs • Costs for storage, handling, insurance, etc • Setup (or production change) costs • Costs for arranging specific equipment setups, etc • Ordering costs • Costs of someone placing an order, etc • Shortage costs • Costs of canceling an order, etc
Multi-Period Models: Fixed-Order Quantity Model Model Assumptions Demand for the product is constant and uniform throughout the period Lead time (time from ordering to receipt) is constant Price per unit of product is constant Inventory holding cost is based on average inventory Ordering or setup costs are constant All demands for the product will be satisfied (No back orders are allowed)
Basic Fixed-Order Quantity Model and Reorder Point Behavior 4. The cycle then repeats. 1. You receive an order quantity Q. Number of units on hand Q Q Q R L L 2. Your start using them up over time. 3. When you reach down to a level of inventory of R, you place your next Q sized order. Time R = Reorder point Q = Economic order quantity L = Lead time
Basic Formulas Total Cost Total Ordering and Carrying Cost Economic Order Quantity Reorder Point TC=Total annual cost D = Yearly Demand (d is daily demand) C =Cost per unit Q =Order quantity S =Cost of placing an order or setup cost R =Reorder point L =Lead time i=Annual holding and storage cost per unit of inventory expressed at a percentage
EOQ Example (1) Problem Data Determine EOQ and ROP for: • Annual Demand = 1,000 units • Days per year considered in average daily demand = 365 • Cost to place an order = $10 • Holding cost per unit per year = $2.50 • Lead time = 7 days • Cost per unit = $15
EOQ Example (2) Problem Data • Determine EOQ and ROP for – • Annual Demand = 10,000 units • Days per year considered in average daily demand = 365 • Cost to place an order = $10 • Holding cost per unit per year = 10% of cost per unit • Lead time = 10 days • Cost per unit = $15
Summary of Some Key PointsRe: EOQ Model • How much to order: Economic Order Quantity Q* • When to order: Reorder Point • Total Cost (Item plus Holding plus Ordering)
EOQ Class Problem Dickens Electronics stocks and sells a particular brand of PC. It costs the firm $450 each time it places and order with the manufacturer. The cost of carrying one PC in inventory for a year is $170. The store manager estimates that total annual demand for computers will be 1200 units with a constant demand rate throughout the year. Orders are received two days after placement from a local warehouse maintained by the manufacturer. The store policy is to never have stockouts. The store is open for business every day of the year. Determine the following: • Optimal order quantity per order. • Minimum total annual inventory costs (i.e. carrying plus ordering – ignore item costs). • The optimum number of orders per year (D/Q*) • The reorder point.
Problem 2 A store specializing in selling wrapping paper is analyzing their inventory system. Currently the demand for paper is 100 rolls per week, where the company operates 50 weeks per year.. Assume that demand is constant throughout the year. The company estimates it costs $20 to place an order and each roll of wrapping paper costs $5.00 and the company estimates the yearly cost of holding one roll of paper to be 50% of its cost. • If the company currently orders 200 rolls every other week (i.e., 25 times per year), what are its current holding and ordering costs (per year)?
Problem 2 • The company is considering implementing an EOQ model. If they do this, what would be the new order size (round-up to the next highest integer)? What is the new cost? How much money in ordering and holding costs would be saved each relative to their current procedure as specified in part a)? • The vendor says that if they order only twice per year (i.e., order 2500 rolls per order), they can save 10 cents on each roll of paper – i.e., each roll would now cost only $4.90. Should they take this deal (i.e., compare with part b’s answer) [Hint: For c]. calculate the item, holding, and ordering costs in your analysis.]
ABC Classification System 60 % of $ Value A 30 B 0 C % of Use 30 60 • Items kept in inventory are not of equal importance in terms of: • dollars invested • profit potential • sales or usage volume • stock-out penalties So, identify inventory items based on percentage of total dollar value, where “A” items are roughly top 15 %, “B” items as next 35 %, and the lower 65% are the “C” items