Download
1 / 39
390 likes | 600 Views
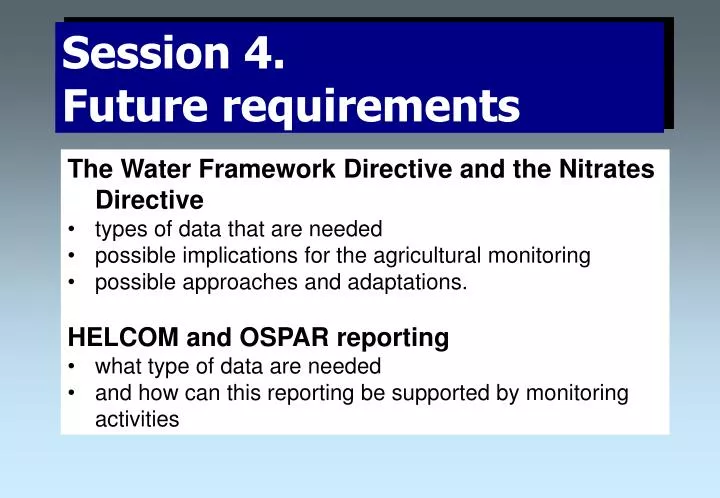
Session 4. Future requirements. The Water Framework Directive and the Nitrates Directive types of data that are needed possible implications for the agricultural monitoring possible approaches and adaptations. HELCOM and OSPAR reporting what type of data are needed

E N D
Session 4. Future requirements • The Water Framework Directive and the Nitrates Directive • types of data that are needed • possible implications for the agricultural monitoring • possible approaches and adaptations. • HELCOM and OSPAR reporting • what type of data are needed • and how can this reporting be supported by monitoring activities
WFD objectives • protection of ALL water resources (ground water, reservoirs, rivers, lakes, transitional and coastal waters) • prevention of further deterioration of surface waters • rational use of water based on precautionary & “polluter pays” principle • water management based on river basins • getting the citizen involved more closely • streamlining legislation (Urban Waste Water Treatment Directive, the Nitrates Directive, and the Integrated Pollution Prevention and Control Directive) • "combined approach" of emission limit values and quality standards • achieving good surface water status all over EU (15 yr)
Achieving ‘good surface water status’ all over EU before 2015 • Determined by chemical and ecological status • Chemical status: • concentrations of specific pollutants not exceeding specified levels • Ecological status: • expression of the quality of the structure and functioning of aquatic ecosystems
Hydromorphological Quality Elements Chemical and Physico-Chemical Quality Elements Quality elements for ecological status Biological Quality Elements (e.g. macrobenthos, zooplankton, fish)
Time table for WFD 2003-2006 Identifying river basin districts Transposition in national legislation 2003 Characterization of surface water types 2004 Reference condition Ecological quality classification Identifying pressures and impacts Monitoring strategies, (Intercalibration, EQR) and public consultation 2005-6
1 High Good Moderate Poor Bad 0 Setting the Ecological Quality Ratio (EQR) for Classification of surface waters Reference value EQR = Parameter value Biological quality elements
Assessment of goal achievement Per Stålnacke Jordforsk - Norwegian Centre for Soil and Environmental Research per.stalnacke@jordforsk.no
Helcom Recommendations and EU Directives • All the Baltic Sea countries except Russia have obligations to implement the EU Directives and Regulations as well as HELCOM recommendations concerning agricultural, municipal and industrial nutrient load reductions • Revision of the HELCOM targets/goals after PLC-4 in 2003
Agricultural nutrient emissions and losses to waters will be crucial parameters for the determination of the chemical/ecological status in river basins and in the RBMP River basin district
Emissions of nitrogen to surface waters in the Baltic Sea basin in the 1980sSource: Stålnacke, 1996
Have the nutrient emissions from agriculture decreased in the Baltic Sea basin?
’Anthropogenic’ flow-normalised nitrogen load from agriculture (SYKEI, 2002)
’Anthropogenic’ flow-normalised nitrogen load from agriculture (SYKE, 2002) Monitored decrease in agricultural catchments
’Anthropogenic’ flow-normalised nitrogen load from agriculture (SYKE, 2002) Modelled decrease
’Anthropogenic’ flow-normalised nitrogen load from agriculture (SYKE, 2002) River catchment monitoring Monitoring agricultural catchments
’Anthropogenic’ flow-normalised nitrogen load from agriculture (SYKE, 2002) Extrapolation from other countries Agricultural statistics
’Anthropogenic’ flow-normalised phosphorus load from agriculture (SYKE, 2002)
Have the rivers responded to the decreased nutrient emissions from agriculture ?
Emajogi (Estonia) Daugava and Lielupe River (Latvia) Tisza (Hungary) In addition: literature review
Strong evidence of riverine response of nitrogen in Hungary (Stålnacke et al)
Some evidence of riverine response of nitrogen in Estonia Loigu et al (in prep)
Weak evidence of riverine response of nitrogen in Latvia Stålnacke et al (manuscript)
Weak evidence of riverine response of nitrogen in Latvia Stålnacke et al (manuscript)
No/weak evidence of riverine response of phosphorus in Estonia Stålnacke et al (in prep)
Evidence of riverine response of phosphorus in Latvia Stålnacke et al (manuscript)
Reported trends in nutrient concentrations in Eastern Europe Stålnacke et al (submitted)
The most important ‘hydrological’ processes/pathways as regards nitrogen and phosphorus losses from diffuse sources to surface waters (e.g. first-order streams).Source: Borgvang and Selvik (2000).
Hydrological response to various tile drainage spacings(Deelstra et al., 1998)
Factors that contribute to the delay in riverine responses • Wet soil conditions (e.g. poorly drained soils, groundwater table) • Long residence times for water in soil and or/catchment (e.g hydrological pathways, tile drain spacing) • High carbon content in soils (organic matter) • High soil pH (ammonia volatilisation) • Natural variability (e.g., hydrometeorological variation)
Natural variation in nutrient losses may impede the detection of existing trends Observed and flow-normalised nitrate-N+nitrite-N loads in the Rönneå River (S Sweden)Source: Anders Grimvall
Natural variation in nutrient losses may impede the detection of existing trends Observed and flow-normalised nitrate-N load on the Elbe River at Schnackenburg.After Hussain et al (in prep.)
Assessment of goal achievementsCONCLUSIONS • Nutrient levels have in some cases responded and in others not responded to the decrease in agricultural emissions • Extensive cuts in nutrient inputs do not necessarily cause an immediate response, particularly in medium-sized and large catchment areas • Hydrological conditions and hydrological pathways are important for the understanding of the retention of nutrient and thus for riverine response to changes in agricultural emissions • Separation of ‘natural’ and ‘human impact’ nutrient-loss variability is important
CONCLUDING REMARK ’There is a need to further develop methodologies by which to measure diffuse agricultural loading, as well as generally accepted methodologies for determining discharges/losses from diffuse sources into surface waters’ Laane et al., 2002