Download

1 / 12
120 likes | 237 Views
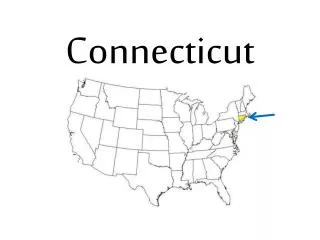
Connecticut Outlook 2002:1 to 2006:4. Edward J. Deak, Ph.D. Professor of Economics Fairfield University Connecticut Model Manager NEEP. Tracking the CT Recession. CT Indicator Best Low Diff Mar 2002 Nonag Emply 7/00 12/01 -28.9k 1,672.5k 1,701k 1,672k

E N D
Connecticut Outlook2002:1 to 2006:4 Edward J. Deak, Ph.D. Professor of Economics Fairfield University Connecticut Model Manager NEEP
Tracking the CT Recession CT Indicator Best Low Diff Mar 2002 Nonag Emply 7/00 12/01 -28.9k 1,672.5k 1,701k 1,672k Unemply Rate 6-8/00 12/01 +1.9% 3.5% 2.1% 4.0% Wkly New Clms 9/00 10/01 +2,886 4,764 3,168 6,054 Labor Force 7/00 3/02 -45k 1,708k 1,753k 1,708k
CT Forecast 2002 Indicator 2001 2002 %CT %US Jobs (mil) 1.683 1.675 -0.5 -0.6 Mfg Jobs(th) 254 245 -3.7 -3.7 Serv Jobs (th) 1,119 1,117 -0.2 0.0 RPer Inc (B$96) 133.7 133.3 -0.3 0.1 UE Rate (%) 3.3 4.1 5.9% Home Pmts 9,011 8,818 -2.2 -5.2 Lab Force (mil) 1.718 1.716 -0.1 0.8 RGSP (B$96) 155.79 159.04 2.1 1.8
Major Job Cuts 10/01-4/02 Clairol 720 – Chemicals B/E Aerospace 350 – Aerospace Bindley Western 200 – Wholesale Black & Decker 200 - Appliances Hamilton-Sund 350 – Aerospace GE Capital 250* - Financial Services Skandia 120 – Financial Services Gerber Scientific 150 – Instruments Praxair 100 – Aerospace Milford Fronton 220 - Services
Major Job Addition 10/01-4/02 Pratt & Whitney 700 – Aerospace Mohegan Sun 500 – Government Electric Boat 500 – Transportation Sikorsky Aircraft 150 – Transportation Fleet Financial 100 – Fin Services Wal-Mart 250 – Retail Home Depot 120 – Retail Burlington Coat 100 - Retail
CT Forecast to 2006 CT Indicator 2002 2003 2004 2005 2006 Jobs (mil) 1.675 1.697 1.722 1.733 1.745 Mfg Jobs (th) 244.6 248.7 250.8 250.1 249.4 Serv Jobs (mil) 1.117 1.135 1.159 1.172 1.185 Per Inc ($B96) 133.3 134.7 137.4 139.8 142.2 Home Pmts 8,818 8,971 8,831 8,873 8,911 Lab Force (mil) 1.716 1.726 1.732 1.740 1,749 RGSP (B$96) 159.0 165.3 170.2 175.3 180.5 Pop (mil) 3.436 3.441 3.445 3.450 3.455
CT Demographics Indicator U.S. CT Mass Pop 4/1/00 mil 281.421 3.405 6.349 Pop 4/1/90 mil 248.710 3.287 6.016 % Chg 1990-00 13.1 3.6 5.5 % Male-Female 49.1-50.9 48.4-51.6 48.2-51.8 %White-Black 75.1-12.3 81.6-9.1 84.5-5.4 %Hisp-Asian 12.5-3.6 9.4-2.4 6.8-3.8 %<18 years 25.7 24.7 23.6 %>65 years 12.4 13.6 13.5 Median age yrs 35.3 37.4 36.5
CT County Demographics County Pop W/B <18 >65 Median Age Fairfield 6.6 79-10 25.6 13.3 37.3 Hartford 0.6 77-12 24.6 14.7 37.7 Litchfld 4.7 96-1 24.6 14.2 39.6 Middlesex 8.3 91-4 23.2 13.6 38.6 New Hvn 2.5 79-11 24.5 14.5 37.0 New Lndn 1.6 87-5 24.4 13.0 37.0 Tolland 6.0 92-3 23.1 10.2 35.7 Windham 6.4 91-2 25.1 12.3 36.3
CT Forecast Risks National: Energy prices Federal Reserve interest rate hikes Lackluster equity markets Global instability State: Resolution of State Budget deficit Energy cost + availability Defense + IT spending