Download
1 / 43
460 likes | 725 Views
REG 265 Surface Drainage. Objectives Identify rural drainage requirements and design Ref: AASHTO Highway Drainage Guidelines (1999), Guidelines for Road Drainage Design (Design Floods & Culvert Design – 2004)). 2. Surface Drainage. Surface water removed from pavement and ROW

E N D
Objectives Identify rural drainage requirements and design Ref: AASHTO Highway Drainage Guidelines (1999), Guidelines for Road Drainage Design (Design Floods & Culvert Design – 2004)) 2
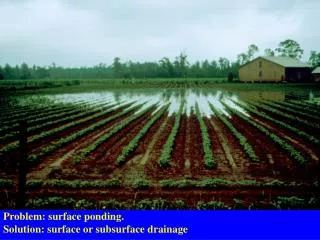
Surface Drainage Surface water removed from pavement and ROW Redirects water into appropriately designed channels Eventually discharges into natural water systems Garber & Hoel, 2002 3
Surface Drainage Two types of water Surface water – rain and snow Ground water – can be a problem when a water table is near surface Garber & Hoel, 2002 4
Inadequate Drainage Damage to highway structures Loss of capacity Visibility problems with spray and loss of retroreflectivity Safety problems, reduced friction and hydroplaning Garber & Hoel, 2002 5
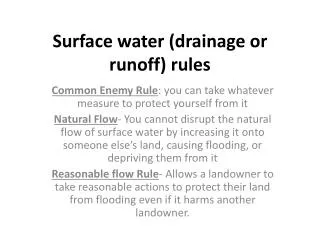
Drainage Transverse slopes Removes water from pavement surface Facilitated by cross-section elements (cross-slope, shoulder slope) Longitudinal slopes Minimum gradient of alignment to maintain adequate slope in longitudinal channels Longitudinal channels Ditches along side of road to collect surface water after run-off 6
Surface Drainage System Design Tradeoffs: Steep slopes provide good hydraulic capacity and lower ROW costs, but reduce safety and increase erosion and maintenance costs 10
Surface Drainage System Design Three phases Estimate quantity of water to reach the system Hydraulic design of system elements Comparison of different materials that serve same purpose 11
Hydrologic Analysis: Rational Method Useful for small, usually urban, watersheds (<10acres, but DOT says <200acres) Q = CIA (English) or Q = 0.0028CIA (metric) Q = runoff (ft3/sec) or (m3/sec) C = coefficient representing ratio of runoff to rainfall I = intensity of rainfall (in/hour or mm/hour) A = drainage area (acres or hectares) The Rational Method 12
Runoff Coefficient Coefficient that represents the fraction of rainfall that becomes runoff Depends on type of surface The Rational Method 13
Runoff Coefficient depends on: Character of surface and soil Shape of drainage area Antecedent moisture conditions Slope of watershed Amount of impervious soil Land use Duration Intensity 14
Runoff Coefficient - rural The Rational Method 15
Runoff Coefficient - urban 16 The Rational Method
Runoff Coefficient For High Intensity Event (i.e. 100-year storm) The Rational Method 17
Runoff Coefficient For High Intensity Event (i.e. 100-year storm) C = 0.16 for low intensity event for cultivated fields C = 0.42 for high intensity event 18 The Rational Method
Runoff Coefficient When a drainage area has distinct parts with different C values Use the weighted average C = C1A1 + C2A2 + ….. + CnAn ΣAi 19
Watershed Area For DOT method measured in acres (hectares) Combined area of all surfaces that drain to a given intake or culvert inlet Determine boundaries of area that drain to same location i.e high points mark boundary Natural or human-made barriers 20
Watershed Area Topographic maps Aerial photos Digital elevation models Drainage maps Field reviews 21
Intensity Average intensity for a selected frequency and duration over drainage area for duration of storm Based on “design” event (i.e. 50-year storm) Overdesign is costly Underdesign may be inadequate Duration is important Based on values of Tc and T Tc = time of concentration T = recurrence interval or design frequency 22
Design Event Recurrence Interval 2-year interval -- Design of intakes and spread of water on pavement for primary highways and city streets 10-year interval -- Design of intakes and spread of water on pavement for freeways and interstate highways 50 - year -- Design of subways (underpasses) and sag vertical curves where storm sewer pipe is the only outlet 100 – year interval -- Major storm check on all projects 23
Time of Concentration (tc) Time for water to flow from hydraulically most distant point on the watershed to the point of interest Rational method assumes peak run-off rate occurs when rainfall intensity (I) lasts (duration) >= Tc Used as storm duration Iowa DOT says don’t use Tc<5 minutes 24
Time of Concentration (Tc) Depends on: Size and shape of drainage area Type of surface Slope of drainage area Rainfall intensity Whether flow is entirely overland or whether some is channelized 25
Tc: Equation from Iowa DOT Manual See nomograph, next page 26
Nomograph Method Trial and error method: Known: surface, size (length), slope Look up “n” Estimate I (intensity) Determine Tc Check I and Tc against values in Table 5 (Iowa DOT, Chapter 4) Repeat until Tc (table)~ Tc (nomograph) Peak storm event occurs when duration at least = Tc 27
Example (Iowa DOT Method) Iterate finding I and Tc L = 150 feet Average slope, S = 0.02 (2%) Grass Recurrence interval, T = 10 years Location: Keokuk Find I From Iowa DOT Design Manual 28
knowns Tc=18 First guess I = 5 in/hr 30
Example (continued) Tc with first iteration is 18 min Check against tables in DOT manual Keokuk is in SE: code = 9 31
For intensity of 5 inch/hr, duration is 15 min Tc from nomograph was 18 min ≠ 15 min Tc ≠ Duration Next iteration, try intensity = 4.0 inch/hr 33
Slope = 0.02 I = 4.0 inches/hr Tc = 20 min For second iteration, tc = 20 min 34
Example (continued) I = 4.0 inches/hour is somewhere between 30 min and 15 min, Interpolate … OK! 35
What does this mean? It means that for a ten-year storm, the greatest intensity to be expected for a storm lasting at least the Tc (18 min.) is 4.0 inches per hour … that is the design intensity 36
Can also use equation, this example is provided in Chapter 4-4 of the Iowa DOT manual 37
Rational Method used for mostly urban applications limited to about 10 acres in size (some sources suggest 200-acre limit) Q = CIA Calculate Q once C, I, and A have been found 38
Area Area of watershed Defined by topography Use GIS contours in lab 39
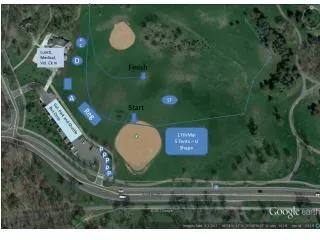
Lab-type Example 60-acre watershed 50-year storm Mixed cover Rolling terrain 41
What would the flow have been had we used the rational method? Q=CIA Say, c = 0.2 (slightly pervious soils) I=? Assume round watershed of 60 acres = 60/640 = 0.093 sq mi … L=D≈1800’ , assume slope=4% (rolling?) … Tc for I=6in/h = 41 min vs. 60 min … I=4.8in/h = 45 min vs. 30 min … call it 5.5in/h A=60 … Q=.2×5.5×60 = 66 CFS vs. 108 cfs 43