Download
1 / 18
180 likes | 380 Views
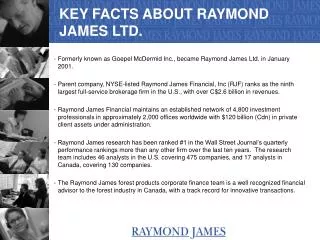
Annual Report Raymond James James Morey Section 001. What is Raymond James Investment Services?. The Chief Executive Officer for Raymond James is Paul Reilly. Their Home location is 880 Carillon Parkway, St. Petersburg, Florida 33716 The Fiscal Year ended on September 30 th

E N D
What is Raymond James Investment Services? • The Chief Executive Officer for Raymond James is Paul Reilly. • Their Home location is 880 Carillon Parkway, St. Petersburg, Florida 33716 • The Fiscal Year ended on September 30th • Raymond James Investment Services provide Financial investors who help their members invest in companies who have the highest probability of producing a profit which is then reflected in common stock. • They are located internationally as well as locally but their main operations are in the Central Florida Area.
Audit Report The United States Securities and Exchange Commission audited Raymond James Investment Services.
Stock Market Information • The current price per share is $24.96. • Raymond James’ Current Annual Range: 52 week High: $32.89 • 52 Week Low: $10.77 • In 2009 Raymond James’ dividend per share was $1.29 • I personally would buy stock from Raymond James because they have a great deal of experience dealing with Financial investments so there will always be a profit.
Company Plans • Raymond James Investment Services has had a rough time with producing major profits due to the economic recession which has occurred, but they have held on and remained profitable in all four quarters of 2009. • http://www.raymondjames.com/annualreport/index.htm
Statement Of Cash Flows • In 2009 Raymond James’ Net Income was less than its Cash Flow from operations, but in 2010 It was quite the opposite; the Net Income was more than the Cash Flow from Operations. • The company makes its profit through fees they acquire when the invest their client’s money.
Statement of Cash Flows • The company’s cash flow has decreased since 2008. • Raymond James is currently not expanding but they will expand in the future.
Accounting Policies • The Sales from Raymond James are shown underneath the Revenues portion since the company is a financial service company they don’t sell a certain product. This company makes a profit off of fees charged to clients and in turn Raymond James tries to turn a profit.
Notes • The Topics to note include, inventory, cash and cash equivalents, Accounts receivable, Goodwill, Investments, Revenue, Cost of Goods Sold, and Interest.
Financial Analysis and Liquidity ratios • Working Capital 2009: $2,233,139 2008:$2,121,227 Current Ratio • 2009: 1.139 • 2008: 1.114
Liquidity Ratios Continued… • Receivable Turnover • 2009: 29.7 times • 2008: 31.5 times • Average day’s Uncollected • 2009: 12.72 days • 2008: 11.59 days
Liquidity Ratios Continued… • Inventory Turnover • 2009: 18.7 • 2008: 22.1 • Average day’s Inventory on Hand • 2009: 19.5 days • 2008: 16.5 days
Profitability Ratios • Profit Margin • 2009: 7.6 % • 2008: 9.9 % • Asset Turnover • 2009: 10.99% • 2008: 11.38% • Return On Assets • 2009: 0.84% • 2008: 1.14% • Return On Equity • 2009: 7.9% • 2008:13%
Solvency Ratios Debt to Equity • 2009: 7.162% • 2008: 8.76%
Market Strength Ratios • Price Earnings Per Share • $ 1.29 • Dividend Yield • Did not state the dividend yield.
Executive Summary • After analyzing the company’s data I can see that overall the year was not as profitable as the past years but the company is expected to make improvement in years to follow. • 2009Annual Report Link • http://www.sec.gov/Archives/edgar/data/720005/000072000509000080/k10093009.htm