Download
1 / 29
290 likes | 415 Views
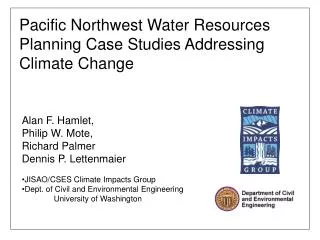
Observed Climate and Streamflow Variability in the Sacramento, San Joaquin, and Colorado River Basins and Projections for the 21 st Century. JISAO Center for Science in the Earth System Climate Impacts Group and Department of Civil and Environmental Engineering University of Washington

E N D
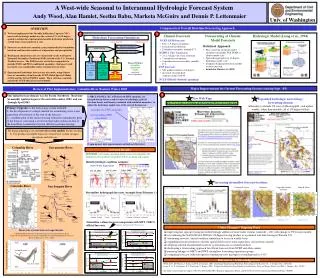
Observed Climate and Streamflow Variability in the Sacramento, San Joaquin, and Colorado River Basins and Projections for the 21st Century JISAO Center for Science in the Earth System Climate Impacts Group and Department of Civil and Environmental Engineering University of Washington November, 2003 Alan F. Hamlet Andrew W. Wood Dennis P. Lettenmaier
Observed Trends in Basin Average Temperature and Precipitation in the Sacramento and San Joaquin River Basins (Water Year 1916-1997) Note: Data is adjusted for topographic variations, and corrections for spurious trends associated with heat island effects, station moves, instrumentation changes, different groupings of stations, etc. have been applied.
Observed Temperature Trends over the Sacramento San Joaquin Basin 1916-1997
Observed Precipitation Trends over the Sacramento San Joaquin Basin 1916-1997
Streamflow Reconstructions from the Paleoclimatic Record Thanks to: Hugo Hidalgo, Scripps Institution of Oceanography Dave Meko, Laboratory of Tree-Ring Research, University of Arizona Connie Woodhouse, Paleoclimatology Branch, NOAA National Climatic Data Center
Sacramento River Flow Reconstructed from Tree Rings (6-year running mean) Source: Meko et. al, 2001, J. Amer. Water Res. Association, 37(4) 1029-39 (Fig 5)
Sacramento and Upper Colorado Annual Flow Reconstructions Concurrent periods of low flow are indicated by pink bands Meko, D.M. and C.A. Woodhouse, in review. Tree-ring footprint of joint hydrologic drought in Sacramento and Upper Colorado river basins, western USA. Journal of Hydrology
Overview of Streamflow Reconstructions for Water Managers: http://www.ncdc.noaa.gov/paleo/streamflow/study.html Sacramento River Reconstructions: Meko, D.M., Therrell, M.D., Baisan, C.H., and Hughes, M.K., 2001, Sacramento River flow reconstructed to A.D. 869 from tree rings: J. of the American Water Resources Association, v. 37, no. 4, p. 1029-1040. Meko, D.M. and C.A. Woodhouse, in review. Tree-ring footprint of joint hydrologic drought in Sacramento and Upper Colorado river basins, western USA. Journal of Hydrology Colorado River Reconstructions: Water Resources Bulletin, 31(5) (Special Issue on climate variability and drought in the Colorado River Basin) Stockton, C.W. and Jacoby Jr., G.C. 1976. Long-term surface-water supply and streamflow trends in the Upper Colorado River Basin based on tree-ring analysis. Lake Powell Research Project Bulletin 18, Institute of Geophysics and Planetary Physics, University of California, Los Angeles.
Some Selected Results from the Accelerated Climate Prediction Initiative (ACPI)
Accelerated Climate Prediction Initiative (ACPI) – NCAR/DOE Parallel Climate Model (PCM) grid over western U.S. A hydrologic simulation model and a reservoir operations model were run in each portion of the domain. Both sensitivity and adaptive response capability were evaluated.
bias-corrected climate scenario from NCDC observations month m month m raw climate scenario from PCM historical run Bias Correction Note: future scenario temperature trend (relative to control run) removed before, and replaced after, bias-correction step.
monthly PCM anomaly (T42) interpolated to VIC scale VIC-scale monthly simulation observed mean fields (1/8-1/4 degree) Downscaling
The Main Impact Pathway in the West: Loss of Snowpack. Reductions in Pacific Northwest Snowpack for PCM Scenarios (low sensitivity)
Results for the Sacramento and San Joaquin Basins Van Rheenen, N.T., A.W. Wood, R.N. Palmer and D.P. Lettenmaier, 2004, Potential Implications of PCM Climate Change Scenarios for Sacramento - San Joaquin River Basin Hydrology and Water Resources, Climatic Change (accepted)
PCM Business-as-Usual scenarios California (Basin Average) BAU 3-run average historical (1950-99) control (2000-2048)
PCM Business-as-Usual Scenarios Snowpack Changes California April 1 SWE
1 month 12 1 month 12 PCM Business-As-Usual Mean Monthly Hydrographs Shasta Reservoir Inflows
Lake Shasta Storage: 4552 taf Trinity Shasta Whiskeytown Oroville (SWP) Dam Power Plant River Transfer Sacramento River Basin Trinity River Clear Creek Feather River Sacramento River American River Folsom Delta
Delta Sacramento-San Joaquin Delta Area: 1200 mi2 Don Pedro/McClure Storage: 3055 taf Pardee/Camanche Reservoir Storage: 615 taf Eastman, Hensley, & Millerton Delta & San Joaquin R Basin Mokelumne River Pardee & Camanche Delta Outflow Millerton Lake Storage: 761 taf New Melones Res Storage: 2420 taf Delta Calaveras River New Hogan Stanislaus River San Luis San Joaquin River New Melones Dam Power Plant River/Canal Transfer Tuolumne & Merced Rivers New Don Pedro & McClure
Current Climate vs. Projected Climate • Storage Decreases • Sacramento • Range: 5 - 10 % • Mean: 8 % • San Joaquin • Range: 7 - 14 % • Mean: 11 %
Current Climate vs. Projected Climate • Hydropower Losses • Central Valley • Range: 3 - 18 % • Mean: 9 % • Sacramento System • Range: 3 – 19 % • Mean: 9% • San Joaquin System • Range: 16 – 63 % • Mean: 28%
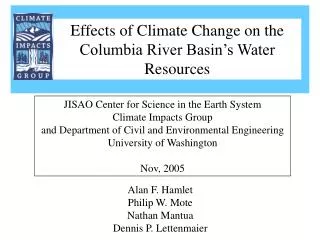
Results for Colorado River Basin Christensen, N.S., Wood, A.W., Voisin, N., Lettenmaier, D.P. and R.N. Palmer, 2004, Effects of Climate Change on the Hydrology and Water Resources of the Colorado River Basin, Climatic Change, (accepted)
PCM Projected Colorado R. Basin Termperature ctrl. avg. hist. avg. Period 1 2010-2039 Period 2 2040-2069Period 3 2070-2098
PCM Projected Colorado R. Basin Precipitation hist. avg. ctrl. avg. Period 1 2010-2039 Period 2 2040-2069Period 3 2070-2098
Changes to Seasonal Hydrograph Simulated Historic (1950-1999)Period 1 (2010-2039)Control (static 1995 climate)Period 2 (2040-2069)Period 3 (2070-2098)
Deliveries to Central Arizona Project & Los Angeles Metro. Water District 1 BCM = 810,832 acre-ft
Conclusions and Comparative Analysis • 1) California system operation is dominated by water supply (mostly ag), the reliability of which would be reduced significantly by a combination of seasonality shifts and reduced (annual) volumes. Partial mitigation by altered operations is possible, but complicated by flood issues. • 2) Colorado system is sensitive primarily to annual streamflow volumes. Low runoff ratio makes the system highly sensitive to modest changes in precipitation (in winter, esp, in headwaters). Sensitivity to altered operations is modest, and mitigation possibilities by increased storage are nil (even if otherwise feasible). • 3) These potential impacts highlight the need for contingency planning to cope with reductions in water supply and flexible demand management strategies for the future.