Download
1 / 16
160 likes | 256 Views
Measuring RNA transcript levels. Research problem. P T. P E. oriT. P c. intDOT. attL. attR. tetQ. excision. ermF. transfer. mob. regulatory. RteR. Question: precisely where in the transfer region is RteR binding???.

E N D
Research problem PT PE oriT Pc intDOT attL attR tetQ excision ermF transfer mob regulatory RteR Question: precisely where in the transfer region is RteR binding??? • A small RNA, RteR, inhibits transfer of the 65 kb conjugative transposon CTnDOT
Possible means of measuring transcript levels • Promoter fusions • Qualitative RT-PCR • Quantitative or “real time”: RT-qPCR • Northern blotting analysis • 5’ and 3’ RACE • lengths of transcript rather than abundance
Promoter fusions • A reporter gene (e.g. lacZ) is fused to a promoter of interest to test for transcriptional activity • This represents only activity of promoter, and thus excludes other levels of transcriptional regulation lacZ -35 -10
Reverse transcriptase (RT)-PCR • A.k.a. qualitative or endpoint • RT is “reverse transcriptase”: synthesize cDNA from total RNA pools • Generally isolate RNA from different cell treatments, e.g.: • Carbohydrate source • Aerobic vs. anaerobic growth • Growth phase • With and/or without gene of interest in trans
Transcript levels +/- small RNA, RteR Ptra A B C D E F G H I J K L M N O P Q RteR
Quantitative or “real time” PCR • Gives you information in real time after each cycle • For obvious reasons a quantitative value, rather than a subjective relative value, can be more interesting and meaningful
Calculating when a sample crosses a given threshold (Ct or Cq) to quantify transcript abundance
Caveats to qPCR • Experimental methods/calculations can greatly skew results, as with any technique • Many have false sense of trust in the word “quantitative” believe technique is inherently more accurate
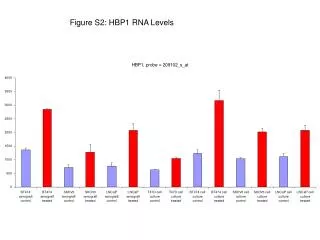
Northern blotting • Another means of (literally) visualizing transcript levels • Can detect RNA processing events that would other wise be unnoticed in RT-PCR • Caveat is that it is qualitative, and there is a limit to transcript size due to electrophoresis capabilities
RteR Northern blotting analysis 150 T7 promoter 100 PCR 90 T7 promoter 80 70 60 In vitro transcription reaction + 32P-αUTP 50 40 30 Antisense ssRNA probe to region of interest
Can detect multiple transcripts 150 100 80 60 40
RACE analysis to identify 5’ and 3’ ends of RteR Total RNA 5’ RACE 3’ RACE OH-3’ calf. Int. phos. adapter ligation 5’-PPP 5’-PPP 5’-PPP + TAP - TAP 5’-P 5’-P 5’-P 5’-P adapter ligation cDNA synthesis PCR cDNA synthesis PCR processed end primary end