Download
1 / 19
190 likes | 641 Views
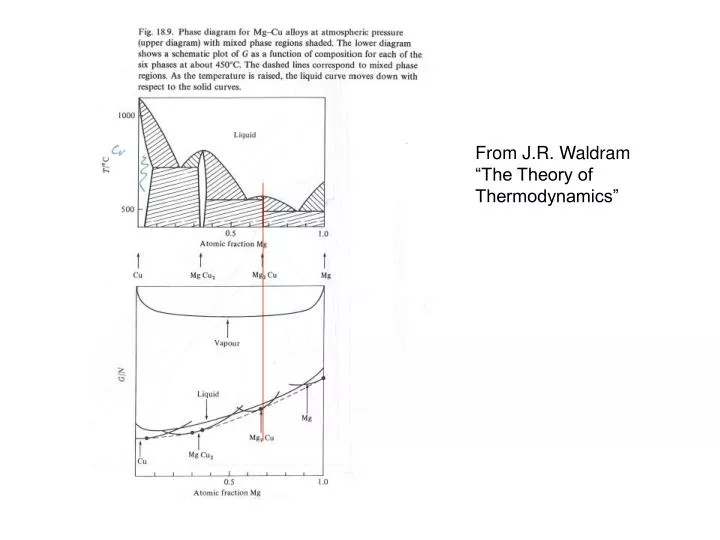
From J.R. Waldram “The Theory of Thermodynamics”. Alloy phase diagram of Cu-Ni. http://people.virginia.edu/~lz2n/mse209/Chapter9-p1.pdf. Eutectic Phase Diagram.

E N D
From J.R. Waldram “The Theory of Thermodynamics”
Alloy phase diagram of Cu-Ni http://people.virginia.edu/~lz2n/mse209/Chapter9-p1.pdf
Eutectic Phase Diagram NOTE: at a given overall composition (say: X), both the relative amounts of the two phases (a,b or c,d) AND the composition of one (or possibly both) depend on the temperature http://www.tulane.edu/~sanelson/geol212/2compphasdiag.html
Critical Opalescence At the critical point in a fluid, you get large fluctuations in the density (because the energy cost of creating density changes goes to zero). Consequently, the fluid scatters light very well right at the transition. A goo example of this can be seen in the You-tube video: http://www.youtube.com/watch?v=OgfxOl0eoJ0 A somewhat more “dramatic”, but less useful version of the same thing may be seen at the site: http://www.youtube.com/watch?v=2xyiqPgZVyw&feature=related A demonstration with a clearer explanation (by Martin Poliokoff of U. Nottingham) of what is happening, but less compelling video, may be seen at: http://www.youtube.com/watch?v=yBRdBrnIlTQ&feature=fvw
Fe-C Phase Diagram Austenite: g Ferrite: d Martensite: metastable phase formed by quenching g into the 2-phase region. Solid lines show Fe-C equilibrium Phase Diagram, Dashed lines show metastable Fe-Fe3C diagram From T. B. Massalski Atlas of Binary Phase Diagrams
Quenching Al-Zn alloys into metastable (left ) or unstable (middle) areas of the phase diagram. Notice the different morphology of the phase separated regions as the alloy is allowed to approach equilibrium. Nucleation and growth (left, see HW11) vs. “spinodal decomposition”
Proposed Nuclear Matter phase diagram http://www.kfa-juelich.de/nic/Publikationen/Broschuere/Elementarteilchenphysik/hadron.jpg
Quark Gluon plasma (RHIC) http://www.google.com/imgres?imgurl=http://gruppo3.ca.infn.it/usai/cmsimple3_0/images/PhaseDiagram.png&imgrefurl=http://gruppo3.ca.infn.it/usai/%3FResearch:Phase_Transition&h=771&w=1042&sz=200&tbnid=0xQaMFwZufgtxM:&tbnh=111&tbnw=150&prev=/images%3Fq%3DQuark%2Bgluon%2Bplasma%2Bphase%2Bdiagram&usg=__OGqEE_0lIz0fOUddpDFtuCIgeG8=&ei=4HXMS8GkBILw9AS_uoTCBg&sa=X&oi=image_result&resnum=3&ct=image&ved=0CAoQ9QEwAg
Spinodal Decomposition (unstable part of a binary phase diagram) See the wikipedia article on this for a nice “movie” of how the microstructure evolves. http://en.wikipedia.org/wiki/Spinodal_decomposition
From Zemansky “Heat and Thermodynamics” MFT From Chaikin and Lubensky: “Principles of Condensed Matter Physics” 1995.
From Kadanoff et al. Rev. Mod. Phys. 35, 395 (1967) NOTE: similar b values for magnetism And gases!
Superfluid Transition: 4He The above figure is taken from: http://hyperphysics.phy-astr.gsu.edu/Hbase/lhel.html#c2 Interesting video of the properties of superfluid He is available at: http://www.youtube.com/watch?v=2Z6UJbwxBZI
Ferromagnetic Materials If the sample is small enough, or the specific magnetization big enough, the domains may be arranged is a less-that-random arrangement that leads to zero net magnetization for the sample (thereby minimizing the energy associated with the stray field). The above figure from the text demonstrates the typical pattern for a small needle (whisker) of material.
Critical Exponents From P. Chaikin and T Lubensky “Principles of Condensed Matter Physics” Notice that convention allows for different exponents on either side of the transition, but often these are found to be the same.
Universality Classes From P. Chaikin and T Lubensky “Principles of Condensed Matter Physics” Theory suggests that the class (i.e. set of exponents) depends on spatial dimensionality, symmetry of the order parameter and interaction (and range of the latter as well) but not on the detailed form or strength of the interactions
Ising Model • Consider a lattice on which each site is occupied by either a + or a – (up or down spin to model magnetism, A or B element to model a binary alloy etc.). • Label each such state as si (for site I, two possible values). • We assume ONLY nearest-neighbor interactions, and describe that interaction with a single energy scale J. • The total configurational energy is then: E = -J Snn(sisj) • In this model J>0 suggests like neighbors are preferred (lower energy if siand sj are of the same sign) • Exact solutions have been found for 1 and 2 dimensions, not yet for 3 dimensions. • Applications: • Magnetism (both ferromagnetism and antiferromagnetism) • Binary alloys while assuming random arrangements of atoms (Bragg-Williams model) shows phase separation for J>0. • Binary alloys with correlations between bonding and configuration treated via the law of mass action (i.e. bonds forming and breaking; the “Quasi-chemical” approximation) can show order-disorder transitions as well as phase separation etc.