Download

1 / 20
200 likes | 526 Views
Functional MRI study of pressure pain and its modulation using mental imagery. Edward F. Jackson 1 , Charles S. Cleeland 2 , Karen O. Anderson 2 , Robert R. Allen 2 , Tito R. Mendoza 2 , Richard Payne 2 , Guadalupe Palos 2 Department of Radiology 1 and

E N D
Functional MRI study of pressure pain and its modulation using mental imagery Edward F. Jackson1, Charles S. Cleeland2, Karen O. Anderson2, Robert R. Allen2, Tito R. Mendoza2, Richard Payne2, Guadalupe Palos2 Department of Radiology1 and Pain Research Group, Department of Symptom Control and Palliative Care The University of Texas M. D. Anderson Cancer Center
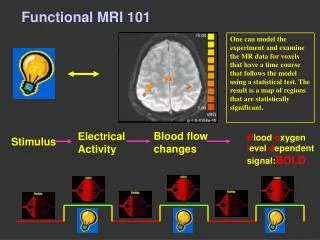
Introduction • Recent PET and fMRI studies have demonstrated the involvement of cortical structures of the limbic system, i.e., the anterior cingulate cortex and the insular cortex, as well as sensory cortex areas SI and SII in the perception of pain1,2. In addition, studies have implicated a disso-ciation of the affective component of pain (unpleasantness) from the intensity of pain3. The present study utilized fMRI to map areas of pain-evoked activation and to quantitate the changes in the levels of activation to further evaluate whether such a dissociation of the two components of pain could be observed when the perceived level of pain was modulated by mental imagery.
Methods and Materials • Scanner and Acquisition Parameters:All images were acquired on a GE 1.5 T Signa Horizon EchoSpeed scanner (v5.6). The fMRI images were acquired using a gradient-echo EPI sequence with TE/TR = 60/3000 ms, Flip angle = 60o, 32 cm FOV, 64x64 matrix, and 95 kHz bandwidth (ramp sampled). Seven 7 mm sections were acquired. Following the EPI acquisitions, 3D FSPGR volume scans and venous and arterial MRA scans were acquired for anatomical-functional overlays and transformations to Talairach coordinates4. • Stimulus:An MR-compatible pressure algometer5 placed between the first and second joints of the index finger provided the painful stimulus. Weight loads ranged from 1.0 - 2.5 kg, and were chosen prior to the fMRI study to generate a mean pain intensity rating of 5.4 on a 0 - 10 scale. • Subjects:Eight normal, right-handed subjects (7 females, 1 male) participated in the study after providing written informed consent.
Methods and Materials 12s 18s 27s … 9s • Paradigm:Five repeated trials (18 s stimulus / 27 s rest) acquired per run. Each run time was 3:39 min. • Three runs were acquired with the last two runs randomized to minimize order effect bias: • Control (State “C”) Subject was verbally instructed to imagine the non-weighted pressure algometer as painful during each 18 s stimulus period • “Toward State” (State “T”) Subject was verbally instructed to focus on the pain resulting from the application of the weighted algometer during each stimulus period • “Away State” (State “A”) Subject was distracted from the pain using verbally-cued mental imagery during the application of the weighted algometer Stimulus Rest
Methods and Materials • Post-Acquisition Processing: • The fMRI, anatomical, and MRA data were processed using AFNI6 version 2. For each run, 2D image registration was performed on all fMRI data to decrease the effects of involuntary motion. The fMRI activation maps were generated using a multiple cross-correlation algorithm, and the activation maps were transformed to Talairach coordinate space. • The resulting 24 fMRI activation maps (8 subjects, 3 runs each) were then analyzed using a 3D ANOVA to generate mean activation maps for the control state, toward state, and away state, as well as the difference maps toward minus control (T-C) and away minus control (A-C). The “treatment effects” map was also generated to test the hypothesis C=A=T.
Methods and Materials • Post-Acquisition Processing (cont): • For each mean or difference map, a 3D cluster analysis program was used to compute the volumes of connected activated voxels in the fMRI maps subject to a p-value threshold of 0.05 and a minimum cluster size of 525 ml (corres-ponding to three connected voxels in the original EPI datasets). • The center of mass of the identified clusters was determined in Talairach coordinates, and the volume of each cluster was computed.
Results • Subjective Pain Ratings: • The subjective mean post-experiment rating of pain intensity was 2.9 in the away state and 6.5 in the toward state (on a scale of 0-10 with 10 being the “worst pain imaginable”). As a comparison, the mean rating in the pre-imaging session (without verbal cueing to focus toward or away from the pain) was 5.4.
Results • Mean Activation Map for Control State • (N = 8, p 0.05, tmin= 2.08) z= - 5 z=+10 z=+25 z=+40
Results • Mean Activation Map for Away State • (N = 8, p 0.05, tmin=2.08, Mean Pain Intensity Rating: 2.9) z= - 5 z=+10 z=+25 z=+40
Results • Mean Activation Map for Toward State • (N = 8, p 0.05, tmin=2.08, Mean Pain Intensity Rating: 6.5) z= - 5 z=+10 z=+25 z=+40
ResultsMean State Activation Volumes Mean Control State: Total Volume: 27.5 ml Mean Away State: Total Volume: 49.3 ml
ResultsMean State Activation Volumes Mean Toward State: Total Volume: 66.5 ml
Results • Mean Difference Maps • (N = 8, p 0.05, tmin = 2.08) Away - Control Toward - Control z= - 5 z= - 5 z=+10 z=+10 z=+25 z=+25 z=+40 z=+40
ResultsMean Difference Map Activation Volumes Mean Away Minus Control Map: Total Volume: 16.6 ml
ResultsMean Difference Map Activation Volumes Mean Toward Minus Control Map: Total Volume: 24.8 ml
DiscussionMean State Activation Volumes • The number and total volume of activated regions increased from the control (27.5 ml) to the away (49.3 ml) to the toward (66.5 ml) states, and this increase correlated with the subjective post-experiment pain intensity ratings. Other than auditory cortex, the activated regions of greatest volume were the anterior cingulate and insular cortex. The volume of activation in the cingulate increased significantly in the toward state and involved BA24 and 32 as compared to only BA24 in the away state. The auditory cortex activation prevented quantitative assessment of the insular cortex activation volumes, but qualitatively the volume increased in the toward state relative to the away state. Other areas of activation were also significant but were of less volume. • Interestingly, the volume of activated auditory cortex increased from the control to the away to the toward conditions. The reason for the modulation of the auditory cortex activation is unknown.
DiscussionMean Difference Map Activation Volumes • The auditory cortex activation due to the verbal cueing tended to limit the quantitative assessment of the volume of activation within the insular cortex. To improve the visualization of the insular cortex activation, the difference maps were computed. As in the mean state maps, the total volume of activation increased from the away (16.6 ml) to the toward (24.8 ml) states, with the primary areas of activation being in the anterior cingulate cortex and insular cortex. Again, the volumes of activation increased in the anterior cingulate cortex and insular cortex in the toward state relative to the away state. The insular cortex activation was more clearly visualized in the difference maps, but probable residual auditory cortex activation remained and prevented accurate assessment of the activation volumes. Minor activation volumes in the caudate, thalamus, and other areas were also noted.
DiscussionMean Difference Map Activation Volumes • While they more clearly showed the activation of the insular cortex and allowed improved qualitative assessment of the degree of activation, the use of the difference maps is not the optimal means of suppressing the auditory cortex activation. This is particularly true with the relatively small number of subjects and the spatial variation in auditory cortex activation in the control vs away vs toward conditions. The auditory cortex activation with verbal cueing might be decreased in the fMRI maps by the presentation of tones having sound pressure levels comparable to those presented during the auditory cueing but presented within the control states.
Conclusion • This study demonstrates the utility of fMRI for the evaluation of the cortical representation of pain and its modulation by mental imagery, and reinforces the previous studies that have demonstrated the involvement of the anterior cingulate cortex and insular cortex in the processing of painful stimuli. The use of fMRI in studies of pharmacological and non-pharmacological interventions should provide a powerful tool for studying the poorly understood mechanisms responsible for the effects of these interventions.
References and Acknowledgments • References: 1) Craig AD, Reiman EM, Evans A, et al. Nature 384:258-260, 1996. 2) Davis KD, Taylor SJ, Crawley AP, et al. J Neurophysiol 77:3370-3380, 1997. 3) Rainville P, Duncan GH, Price DD, et al. Science 277: 968-971, 1997. 4) Talairach J and Tournoux P. Co-Planar Stereotaxic Atlas of the Human Brain, Thieme Medical Publishers, Inc. New York, 1988. 5) Rainwater AJ, McNeil DW. Behav Res Methods 23:486-492, 1991. 6) Cox RW. Comput Biomed Res 29:162-173, 1996. • Acknowledgments: • This work was supported in part by a grant from the National Cancer Institute to C.S.C. (RO1-CA73005).