Download
1 / 60
610 likes | 864 Views
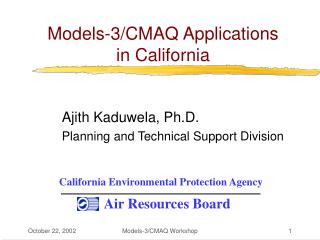
Applications and Evaluation of USEPA’s Models-3/CMAQ System: From Regional and Urban Air Pollution to Global Climate Change . Carey Jang, Pat Dolwick, Norm Possiel, Brian Timin, Joe Tikvart U.S. EPA Office of Air Quality Planning and Standards (OAQPS) Research Triangle Park, North Carolina.

E N D
Applications and Evaluation of USEPA’s Models-3/CMAQ System: From Regional and Urban Air Pollution to Global Climate Change Carey Jang, Pat Dolwick, Norm Possiel, Brian Timin, Joe Tikvart U.S. EPA Office of Air Quality Planning and Standards (OAQPS) Research Triangle Park, North Carolina
OUTLINE • Overview of USEPA’s “One-Atmosphere” Models-3/CMAQ Modeling System • Applications and Evaluation of Models-3 /CMAQ System • OAQPS Modeling Initiative on Intercontinental Transport and Climatic Effects of Pollutants
Third-Generation Air Quality Models:U.S.EPA’s Models-3/CMAQ System • “Open-Access” Community-Based Models : • User-friendly, Modular, Common modeling framework for scientists and policy-makers. • Advanced Computer Technologies : • High performance hardware and software technologies (Cross-platform, GUI, distributed computing, visualization tools, etc.). • “One-Atmosphere” Modeling : • Multi-pollutant (Ozone, PM, visibility, acid deposition, air toxics, etc.), Multi-scale.
“One-Atmosphere” Management and Modeling Mobile Sources Ozone NOx, VOC, PM, Toxics PM (Cars, trucks, planes, boats, etc.) Industrial Sources Acid Rain Chemistry Meteorology Visibility NOx, VOC, SOx, PM, Toxics (Power plants, refineries/ chemical plants, etc.) Air Toxics Atmospheric Deposition Area Sources Climate Change NOx, VOC, PM, Toxics (Residential, farming commercial, biogenic, etc.)
NOx-Related Air Quality Issues (NO3-, NH4+) PM (NOx + VOC + hv) --> Ozone NOx Acid Rain (NO3- deposition) Visibility (Fine PM) Water Quality (Nitrogen deposition, Lake Acidification)
SOx-Related Air Quality Issues (Fine PM) Visibility (SO42-, NH4+) PM SOx Acid Rain (SO42-deposition) Water Quality (Lake acidification, Toxics deposition)
.OH role in pollutants formation : One-Atmosphere PM2.5 SOx [or NOx] + NH3 + OH ---> (NH4)2SO4 [or NH4NO3] VOC + OH ---> Orgainic PM One Atmosphere Ozone Visibility One Atmosphere Fine PM (Nitrate, Sulfate, Organic PM) .OH NOx + VOC + OH + hv ---> O3 Acid Rain Water Quality SO2 + OH ---> H2SO4 NOx + SOx + OH (Lake Acidification, Eutrophication) NO2 + OH ---> HNO3 OH <---> Air Toxics (POM, PAH, Hg(II), etc.) Air Toxics
Example of “One-Atmosphere” Modeling Impact of 50 % NOx Emission Reduction on PM 2.5
Impact of 50% NOx emission reduction Nitrate PM decrease Sulfate PM decrease
Impact of 50% NOx emission reduction O3 decrease HOx decrease
Formation of Secondary PM : Sulfate PM formation: H2SO4 + 2 NH3 ---> (NH4)2SO4 (s) Gas Phase:O2,H2O SO2 + OH ---> H2SO4 Aqueous Phase: H2O SO2 + H2O2 ---> H2SO4 (Dominate over low pH) SO2 + O3 ---> H2SO4 Oraginc PM formation: Gas Phase : VOC + OH ---> Organic PM(semi-volatile) (Long-chain VOCs, Aromatics, Biogenic VOCs) Nitrate PM formation: HNO3 + NH3 <---> NH4NO3 (aq,s) Gas Phase :(daytime) NO2 + OH ---> HNO3 Gas &Aq Phase :(nighttime) N2O5 + H2O ---> HNO3
Impact of 50% NOx emission reduction O3 decrease HOx decrease
Impact of 50% NOx emission reduction Nitrate PM decrease Sulfate PM decrease
Third-Generation Air Quality Models:U.S.EPA’s Models-3/CMAQ • “Open-Access” Community-Based Models : • User-friendly, Modular, Common modeling framework for scientists and policy-makers. • Advanced Computer Technologies : • High performance hardware and software technologies (Cross-platform, GUI, distributed computing, visualization tools, etc.). • “One-Atmosphere” Modeling : • Multi-pollutant (Ozone, PM, visibility, acid deposition, air toxics, etc.), Multi-scale.
Models-3/CMAQ System Framework or Meteorology Processor RAMS or Emission Processor SMOKE Air Quality Model PAVE
Models-3/CMAQ Demo & Evaluation: USEPA/ORD Domain : Eastern U.S.A. Grid Resolution : 36-km/12-km/4-km (Nested Modeling) Episode : July 6 - 16, 1995
O3 Episode in the Northeast U.S. (7/12-15, 1995) Nested 4 km grid domain (144 x 147 cells)
Measurement Sites and Terrain Features (Courtesy of USEPA/ORD, Daewon Byun)
Models-3/CMAQ Applications at EPA/OAQPS • Western U.S. Application • Episodic O3, July 96, 36/12 km, Evaluation completed • Annual Nationwide U.S. Application • 1-atmosphere, annual 1996, 36-km, evaluation & diagnostics, on-going annual 2000 • Eastern U.S. Application • 1-atmosphere, July 95, urban applications, 36/12/4-km, emissions control & growth • Intercontinental Transport/Air Quality & Climate Change • Intercontinental transport and climatic effects of air pollutants
Models-3/CMAQ Modeling: Domain Maps 36 km eastern US domain 4 km domain 12 km domain 12 km western US ozone domain 36 km western US ozone domain 36 km Annual National US domain
Western U.S. Application • Objectives : • New M3/CMAQ Domain • New Episode (July 1996) • Model Setup : • Episodic O3 modeling • Meteorology : MM5 • Emissions : Tier-2 regridded • 36km/12km, 12 layers • Compared against UAM-V 177 153
Modeled Observed
Process Analysis : (Los Angeles grid) Diffusion Process Contribution to O3 (ppm / hr) Chem O3 Conc. O3 Conc. and Trend ( ppm & ppm / hr) dO3/dt Time Step (7/19 - 7/31/96)
Annual Nationwide U.S. Application • Features : • Annual CMAQ Run • Nationwide CMAQ Domain • Model Setup : • Annual PM and O3 (1996) • 36-km, 8 vertical layers • Meteorology : MM5 • Emissions Processing: SMOKE • Model Evaluation: Compared against observed data (IMPROVE & CASTNET) & REMSAD
NOx Emissions SO2 Emissions July 1, 1996
Models-3/CMAQ Simulation: Annual Average PM 2.5 Sulfate PM Organic PM Nitrate PM
Models-3/CMAQ : Monthly Average (July) Sulfate PM PM 2.5 Organic PM Nitrate PM
Models-3/CMAQ : Monthly Average (January) Sulfate PM PM 2.5 Organic PM Nitrate PM
National 1996 CMAQ Modeling: CB4 vs. RADM2 Nitrate PM (Jan. 1996)
Formation of Secondary PM : Sulfate PM formation: H2SO4 + 2 NH3 ---> (NH4)2SO4 (s) Gas Phase: O2,H2O SO2 + OH ---> H2SO4 Aqueous Phase: H2O SO2 + H2O2 ---> H2SO4 (Dominate over low pH) SO2 + O3 ---> H2SO4 Oraginc PM formation: Gas Phase : VOC + OH ---> Organic PM(semi-volatile) (Long-chain VOCs, Aromatics, Biogenic VOCs) Nitrate PM formation: HNO3 + NH3 <---> NH4NO3 (aq,s) Gas Phase : (daytime) NO2 + OH ---> HNO3 Gas &Aq Phase : (nighttime) N2O5 + H2O ---> HNO3
NH3 Sensitivity Modeling Nitrate PM : (January Avg.) Base 50% NH3 reduction 0.62 0.70 0.09 0.08 0.53 1.69 1.16 1.24
National 1996 CMAQ Modeling: O3(July Max in ppb) 56 99 149 62 134 76 132 139 137 107 126 119 131 215 127 144 113 194
National 1996 CMAQ Modeling: Visibility(January Average in Deciview) 18 16 11 19 14 22 9 26 16 26 24 10 9 26 24 15 22 12 24 14 23
National 1996 CMAQ Modeling (January average) Nitrogen Wet Deposition Sulfur Wet Deposition
OAQPS Modeling Initiative on Intercontinental Transport and Climatic Effects of Air Pollution
Air Pollution/Climate Change Modeling Initiative Background : • O3 and PM are not only key air pollutants, but also major climate-forcing substances; • Reduction of non-CO2 substances (e.g., O3 and PM, especially black carbon) could be a viable alternative to CO2 reduction to curb global warming. A key strategy suggested was to focus on air pollution to benefit regional and local air quality and global climate simultaneously (Hansen et al.,PNAS, 2000); • Black carbon could be the second largest heating component after CO2 contributing to global warming; Control of fossil-fuel black carbon could be the most effective method of slowing glabal warming (Jacobson,Nature, 2001);
Climatic Effects of Air Pollution O3 (0.3+0.1) Black (0.8) Carbon (Hansen et al., PNAS, 2001)