Download
1 / 23
240 likes | 376 Views
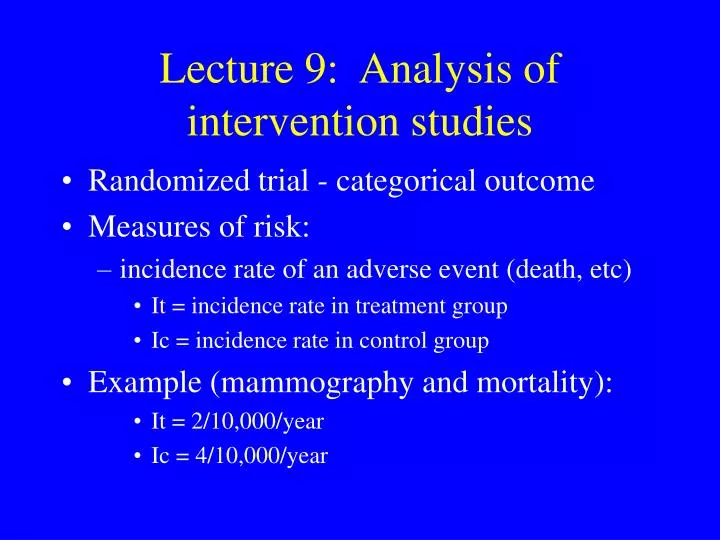
Lecture 9: Analysis of intervention studies. Randomized trial - categorical outcome Measures of risk: incidence rate of an adverse event (death, etc) It = incidence rate in treatment group Ic = incidence rate in control group Example (mammography and mortality): It = 2/10,000/year

E N D
Lecture 9: Analysis of intervention studies • Randomized trial - categorical outcome • Measures of risk: • incidence rate of an adverse event (death, etc) • It = incidence rate in treatment group • Ic = incidence rate in control group • Example (mammography and mortality): • It = 2/10,000/year • Ic = 4/10,000/year
Risk difference and ratio Risk difference = Ic - It/units • usually easier to express as risk reduction • 4 - 2/10,000/year = 1/10,000/year Risk ratio (relative risk) = Ic = 4/2 = 2.0 It Alternatively: = It = 2/4 = 0.50 Ic
Relative risk reduction • Analogous to attributable risk percent • Sometimes called percent effectiveness = risk difference = Ic - It risk in control group Ic = 2/4 = 50% • Can be computed from the risk ratio: 1 - 1 RR = 1 -1/2
Example from GUSTO trial • tissue plasminogen activator (TPA) vs streptokinase (SK) as thrombolytic strategy in treatment of AMI. • 30-day mortality in TPA group = 6.3% • 30-day mortality in SK group = 7.3%
Measures of effect RATE/RISK RATIO SK rate = 7.3 = 1.16 TPA rate 6.3 RELATIVE RISK REDUCTION SK rate – TPA rate = 7.3 – 6.3 = 14% SK rate 7.3 [also calculated as 1 – (1/rate ratio)]
Measures of effect (cont) ABSOLUTE RISK REDUCTION (rate/risk difference; attributable risk) SK rate – TPA rate = 7.3% – 6.3% = 1.0% NUMBER NEEDED TO TREAT (NNT) (Reciprocal of risk difference) 1 = 1 = 100 SK rate – TPA rate .01
SELECTION OF EFFECT MEASURES Ratio measures assess strength of effect - how effective is the treatment? Difference measures take into account frequency of the outcome – can assess whether it is worthwhile (allocation of time and $$) Both ratio and difference measures are needed All these measures are estimates and are subject to sampling error – need confidence intervals to determine their precision All the measures are limited by the study(ies) that generated them – they may vary by patient characteristics, adherence to treatment, duration of follow-up, etc) Measures consider only beneficial and not adverse effects of treatment.
Aspirin in prevention of MI among male smokers (data from Physicians’ Health Study) 5-year incidence of MI: aspirin group = 1.2% placebo group = 2.2% • Risk ratio = 1.8 • Relative risk reduction = 45% • Absolute risk reduction = 1.0% in 5 years • NNT = 100 for 5 years (to prevent 1 MI)
Antihypertensive treatment in 75-year old women with BP of 170/80 (data from SHEP study) • 5-year incidence of stroke: treatment group = 5.2% placebo group = 8.2% • Risk ratio = 1.6 • Relative risk reduction = 37% • Absolute risk reduction = 3.0% in 5 years • NNT = 33 / 5 years (to prevent 1 stroke)
Measures of effect in RCTs: continuous outcomes • Example: RCT of antidepressant vs placebo: • Measures on depression scale at baseline and at follow-up • Possible measures: • Difference in mean scores at follow-up • Difference in change scores from baseline to follow-up
Measures of effect in RCT: adjustment for covariates • Is it necessary? • Compare characteristics of study groups at baseline (statistical testing not appropriate but may be requested!) • Regression models: • time to event: Cox proportional hazards • categorical outcome at point in time: multiple logistic regression • continuous outcome (at point in time or change score): multiple linear regression
Measures of effect in observational studies • Cohort studies: • can use same measures as in RCTs but control of confounding is essential • Case-control studies: • odds ratio may be used to estimate relative risk under certain assumptions • relative risk reduction can be computed as: 1 - 1/OR • risk difference and NNT cannot normally be computed from case-control studies
Example: a quasi-randomized trial of a 2-stage ED intervention for seniors • 2-stage intervention: • screening with ISAR screening tool • (if ISAR 2+): brief, standardized nurse assessment • referrals to primary MD, CLSC, etc, as needed • Patients randomized by day of visit to: • intervention • usual care • Outcomes (4 months after ED visit): • Functional decline
Example: a quasi-randomized trial of a 2-stage ED intervention for seniors • Outcomes (4 months after ED visit): • Functional decline • Change in depresssive symptoms • Caregiver physical and mental health • Patient and caregiver satisfaction with care • Which method of analysis?
Example: Systematic detection and multidisciplinary care of delirium in older medical inpatientsCole et al, CMAJ 2002; 167:753-9 • Intervention group: • Consultation by geriatrician or psychogeriatrician • Identification of associated factors - recommendations • Nurse daily visits • Control group: • Usual care • Limitations?
SCREENING AND ENROLLMENT Screened for delirium (n = 1855) Prevalent delirium (n=243) No prevalent delirium (n=1612) Prevalence rate = 13% Incident delirium (n=56) No incident delirium (n=56) Incidence rate = 3% Total delirium (n=299) Refused (n=72) Randomized (n=227) Intervention (n=113) Control (n=114)
PRIMARY OUTCOME MEASURE Mini-Mental State Exam (MMSE): Every 2-3 days during 1st week, then weekly until discharge If discharged before 8 weeks: 8-week post discharge home assessment
PRIMARY OUTCOME MEASURE (continued) Time to improvement in hospital Improvement = MMSE score persistently at least 2 points higher than initial score
Kaplan-Meier survival curves ofpercent with improved MMSE score
Kaplan-Meier survival curves of percent with improved MMSE scorestratified by dementia
Measure of effect • Hazard ratio (HR) for shorter time to improvement = 1.10 (95% CI: 0.74, 1.63) • Pre-specified sub-group analyses: • no dementia: HR 1.54 (0.80, 2.97) • less comorbidity HR 1.36 (0.75, 2.46) • Conclusion?