Download
1 / 9
90 likes | 197 Views
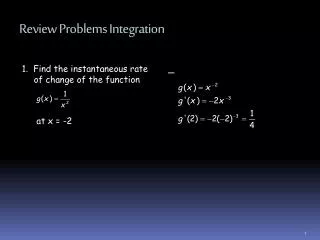
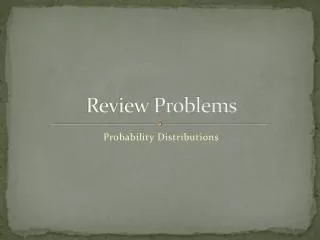
Review Problems. Stat 701: Illustrations. One-Sample Problem. A sample of 12 radon detectors of a certain type was selected, and each was exposed to 100 pCi/L of radon. The resulting readings were as follows: 105.6, 90.9, 91.2, 96.9, 96.5, 91.3, 100.1, 105.0, 99.6, 107.7, 103.3, 92.4.

E N D
Review Problems Stat 701: Illustrations
One-Sample Problem A sample of 12 radon detectors of a certain type was selected, and each was exposed to 100 pCi/L of radon. The resulting readings were as follows: 105.6, 90.9, 91.2, 96.9, 96.5, 91.3, 100.1, 105.0, 99.6, 107.7, 103.3, 92.4 Problem: To test that the population mean reading is 100, and to construct a confidence interval for this population mean. Summary: n = 12, Xbar = 98.375, S = 6.1095
Two-Sample Problem The deterioration of many municipal pipeline networks across the country is a growing concern. One technology proposed for pipeline rehabilitation uses a flexible liner threaded through existing pipe. The following data represents the tensile strength (psi) of liner specimens for when a certain fusion process was used and when this process was not used. The study intended to show that using the fusion process increased the mean tensile strength.
Data • No Fusion: 2748, 2700, 2655, 2822, 2511, 3149, 3257, 3213, 3220, 2753 • Fused: 3027, 3356, 3359, 3297, 3125, 2910, 2889, 2902
Summary of Statistics Descriptive Statistics Variable N Mean Median StDev SE Mean NoFusion 10 2902.8 2787.5 277.3 87.7 Fused 8 3108.1 3076.0 205.9 72.8
Problems to Demonstrate • Testing Equality of Population Means Using T-Test • Confidence Interval for the Difference of Population Means • Testing Equality of Population Variances • Confidence Interval for the Ratio of Population Variances
Testing Equality of Means(Equal Variances) Two Sample T-Test and Confidence Interval Two sample T for NoFusion vs Fused N Mean StDev SE Mean NoFusion 10 2903 277 88 Fused 8 3108 206 73 95% CI for mu NoFusion - mu Fused: ( -455, 45) T-Test mu NoFusion = mu Fused (vs <): T = -1.74 P = 0.050 DF = 16 Both use Pooled StDev = 249
Testing Equality and CI of Means(Unequal Variances) Two Sample T-Test and Confidence Interval Two sample T for NoFusion vs Fused N Mean StDev SE Mean NoFusion 10 2903 277 88 Fused 8 3108 206 73 95% CI for mu NoFusion - mu Fused: ( -448, 38) T-Test mu NoFusion = mu Fused (vs <): T = -1.80 P = 0.046 DF = 15