Download
1 / 21
210 likes | 306 Views
Jun Cao caoj@ihep.ac.cn Institute of High Energy Physics, CAS, Beijing. Determining Reactor Neutrino Flux. Neutrino 2010, Athens, Jun. 14-20, 2010 . Reactor Neutrino Experiments. The first neutrino observation in 1956 by Reines and Cowan.

E N D
Jun Cao caoj@ihep.ac.cn Institute of High Energy Physics, CAS, Beijing Determining Reactor Neutrino Flux Neutrino 2010, Athens, Jun. 14-20, 2010
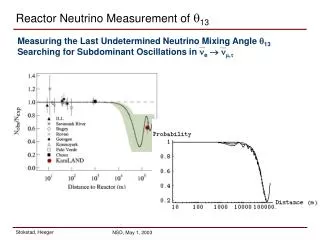
Reactor Neutrino Experiments • The first neutrino observation in 1956 by Reines and Cowan. • Determination of the upper limit of mixing angle theta13 to sin2213<0.17 (Chooz, Palo Verde) • The first observation of reactor anti-neutrino disappearance at KamLAND in 2003. • Precision Experiments on theta13 (Daya Bay, Double Chooz, RENO) • -electron or -nucleus scattering (TEXONO, MUNU, GEMMA, CvNS) • Non-proliferation monitoring (France, US, Russia, Japan, Brazil, Italy) • Possible 60-km baseline experiment
Reactor Neutrino Flux at a Glance • Using PWR (Pressurized Water Reactor) as examples in the following. (3-4)% U-235 enrichment. > 95% is U-238. • Neutrinos from subsequent -decays of fission fragments. U-235 depletion Neutrino spectra, ILL More neutrinos from a U-235 fission than Pu-239 U-235, U-238 Pu-239, Pu-241 Pu-239 breeding X Isotope evolution, Palo Verde 0.1% Visible spectrum, multipled by inverse -decay (IBD) Xsec. Peak at 4 MeV Neutrino rate, Palo Verde Refueling outage Power trips Isotope evolvement
Neutrino Flux Calculation E: Neutrino energy fi : Fission rate of isotope i Si(E): Neutrino energy spectra/f Neutrino Flux (fi /F): Fission fraction Wth: Reactor thermal power ei: Energy release per fission Thermal Power Wth Heat balance test Online calibration Core configuration Thermal power Operations Temperature pressure … … Energy release/fission Core Simulationfi/F Flux Spent fuel Non-equilibrium Spectra of Isotopes Si(E) Measurements Calculations
Thermal Power • KME, thermal power, Secondary Heat Balance Method. • The most accurate measurement. • Offline measurement, weekly or monthly • Generally cited with (0.6-0.7)% uncertainties in literature. • KIT/KDO, thermal power. Good for analysis. • Primary Heat Balance • Online • Weekly calibrated to KME power. • RPN, nuclear power • Ex-core neutron flux monitoring • Online • Safety and reactor operation control • Daily calibrated to KIT/KDO power
Core Simulation • Qualified core simulation code is normally licensed, not available for scientific collaborations. • Need a lot of information from the power plant as inputs, such as configurations, fuel composition, operations (control rods movement, Boron dilution, etc), inlet temperature, pressure, flow rate, etc. • Fission fractions, as a function of burn-up, could be a by-product of the refueling calculation, provided by the power plant. Burn-up is the amount of energy in Mega Watt Days (MWD) released from unit initial mass (ton) of Uranium (TU). For small power variation, fission fraction can be gotten without redoing the simulation. Provided by CNPRI
Spectra of Isotopes • Lack of data of the -decays of the complex fission fragments, theoretical calculation on the neutrino spectra of isotopes carries large uncertainties. • ILL measured the spectra of fissioning of U-235, Pu-239, and Pu-241 by thermal neutrons, and converted them to neutrino spectra. Normalization error 1.9%, shape error from 1.34% at 3 MeV to 9.2% at 8 MeV. • U-238 relies on theoretical calculation, 10% uncertainty (P. Vogel et al., PRC24, 1543 (1981)). Normally U-238 contributes (7-10)% fissions. K. Schreckenbach et al. PLB118, 162 (1985) A.A. Hahn et al. PLB160, 325 (1985) Shape verified by Bugey-3 data Normalization improved to 1.6%
Energy Release per Fission • Slightly varied for different cores due to neutron capture. Uncertainties in (0.30-0.47)%. M.F. James, J. Nucl. Energy 23, 517 (1969) Kopeikin et al, Physics of Atomic Nuclei, Vol. 67, No. 10, 1892 (2004)
U-238 (n,) Reaction • Besides fission products, U-238(n,)U-239 reaction contributes to neutrino yield. It is below inverse- decay threshold (1.8 MeV) but it is important to low energy neutrino-electron scattering experiments (TEXONO, MUNU).
Fission Fission 64.1h 28.78y 90Y 90Sr 2.284MeV 0.546MeV neutron capture 89Sr neutron capture 89Y neutron capture neutron capture Non-equilibrium Isotopes • ILL spectra are derived after 1.5 days exposure time. Long-lived fission fragments have not reached equilibrium. Contribute only to low energy region. • In Chooz paper it is estimated to be ~0.3% and is ignored, comparing to other errors. • Six chains have been identified, with half lives from 10h to 28y. (Kopeikin et al.) Weighted by inverse- decay Xsec. Ratio to neutrinos in 2-4 MeV Ratio to all neutrinos X.C. Ruan et al. (CIAE)
Spent Fuel • Spent fuel stored temporarily adjacent to the core, could be up to 10 years. • Similar to non-equilibrium contributions, long-lived fragments in spent fuel will emit neutrinos. Weighted by IBD Xsec. Contribution from one batch spent fuel It may accumulate to several percent at 2-3 MeV. Ratio to neutrinos in 2-4 MeV Ratio to all neutrinos top Day 0 Day 1 Day 2 Day 3 Day 4 Day 5 Day 10 Day 20 Day 30 Energy Spectra X.C. Ruan et al. bottom
Uncertainties from Past Experiments CHOOZ, Eur. Phys. J. C27, 331 (2003) Palo Verde, PRD62, 072002 R=1.012.8%(stat) 2.7%(syst) Power contributes ~0.7% KamLAND,PRL94:081801, 2005. • Neutrino spectra (1.9% 1.6% with Bugey data) • Inverse -decay cross section (0.2%) • Fission fraction fk (~5%) • Non-equilibrium fragments (0%)
Power Uncertainties • Chooz 0.6%, Palo Verde 0.7%. • Motivation of power uprates by the power plants Study the power uncertainties and improve the instrumentation. • Uncertainties of secondary heat balance is dominated by the flow rate. • Venturi flow meter. Most US reactors. Uncertainty is often 1.4%. It can be as low as 0.7% if properly calibrated and maintained, but suffering from fouling effects, which could grow as high as 3% in a few years. • Orifice plate. France EDF reactors. Typically 0.72%. No fouling effects. Could be improved to 0.4% with lab tests. Note: Above flow meter uncertainties are at 95% C.L. as defined in ISO 5167. Unless specified, the thermal power uncertainty given by the power plant is also at 95% C.L. • Ultrasonic. Start to use in some US and Japan reactors. Type I TT 0.45%, Type II TT 0.2% (Djurcic et al.)
An example • EPRI document prepared by EDF, Improving Pressurized Water Reactor Performance Through Instrumentation:…… (2006) • For N4 reactor (Chooz type) with 4 steam generators: Empirical formula and uncertainty specified in ISO 5167-1-2003. Correlated or Uncorrelated for the 4 flow meters? Orifice Plate • If not assuming the discharge coefficients of the 4 orifice plates are independent, the power uncertainty at 68.3% C.L. will be 0.37%.
Test 1 Test 4 Test 2 Test 3 (MW) (MW) Thermal power Difference (MW) Difference Uncertainty Analysis Another Example • Daya Bay and Ling Ao reactors (EDF, 2.9GWth) are all calibrated with SAPEC system, an EDF portable high precision secondary heat balance test system with its own sensors, databases, and data processing, of uncertainty 0.45%. Ling Ao KME is predicted to have an uncertainty of 0.48% (95% C.L.) • 4 tests on Ling Ao KME show differences from 0.031% to 0.065%. Why? • Used the same orifice plates but different pressure transmitters. • It proves that the uncertainty is dominated by discharge coefficient. • Ling Ao KME is in very good agreement with SAPEC.
Uncertainties of fission fraction • Depends on the simulation code. Only slightly on the inputs (has not been checked on other simulation code.) • Compare measured and calculated concentration of fuel isotopes, sampled at different burn-up. Part of the qualification of the code. One analysis of Apollo 2.5 Lester Miller thesis, ROCS
Uncertainties of fission fraction • Djurcic et al. collected 159 analyses for various codes and various reactors in US and Japan. In average, the simulated concentration of isotopes have uncertainties • U235: ~4% • Pu-239: ~5% • U-238: ~0.1% • Pu-241: ~6% • Assuming the neutron flux in simulation isn’t affected by the small variations, fission rate concentration. • Due to the constraint of the total power, 5% error on simulated isotope concentrations corresponds to ~0.5% uncertainty on the detected rate via IBD reaction. Djurcic et al. J. Phys. G: Nucl. Part. Phys. 36 (2009) 045002
IBD Event Rate Uncertainties • Greatly simplified calculation of IBD rate uncertainties. • Single reactor + single detector • W: thermal power ~ 0.4% (1 sigma), • f: average uncertainties due to 5% fission fraction uncertainty ~ 0.5% • e: average energy release per fission ~0.4% • s: spectra normalization 1.92%. Assuming U-238 contribute 8%. • c: IBD cross section = 0.2% • Single detector + two reactors (equal distance) • Near-far detectors + multiple reactors. All correlated errors (common to all reactors) will cancel out. Uncorrelated errors will reduce depending on the configuration, e.g. to 0.05.
Summary • Before 80’s, the reactor neutrino flux uncertainties ~10%. • With a lot of efforts, especially by ILL, Bugey, Chooz, Palo Verde etc., it is improved to 2-3%. • More accurate thermal power, and more detailed study on errors. • A global picture of uncertainties of fission rate from core simulation. • Small corrections from spent fuel and non-equilibrium contributions. • No new data for neutrino spectra of fuel isotopes, which is dominant for a single detector experiment. Thus for single detector experiments, it is still ~2%. • Next theta13 experiments with near-far relative measurements will suffer little from reactor flux uncertainties (~0.1%), while complex correlation analysis should be done.
Non-proliferation Monitoring Bowden, LLNL, 2008