Download
1 / 14
140 likes | 143 Views
Global Occurrences of Extreme Precipitation and the Madden - Julian Oscillation: Observations and Predictability Charles Jones, Duane E. Waliser, K. M. Lau and William Stern. How does the MJO modulate weather predictability in the tropics and extratropics?

E N D
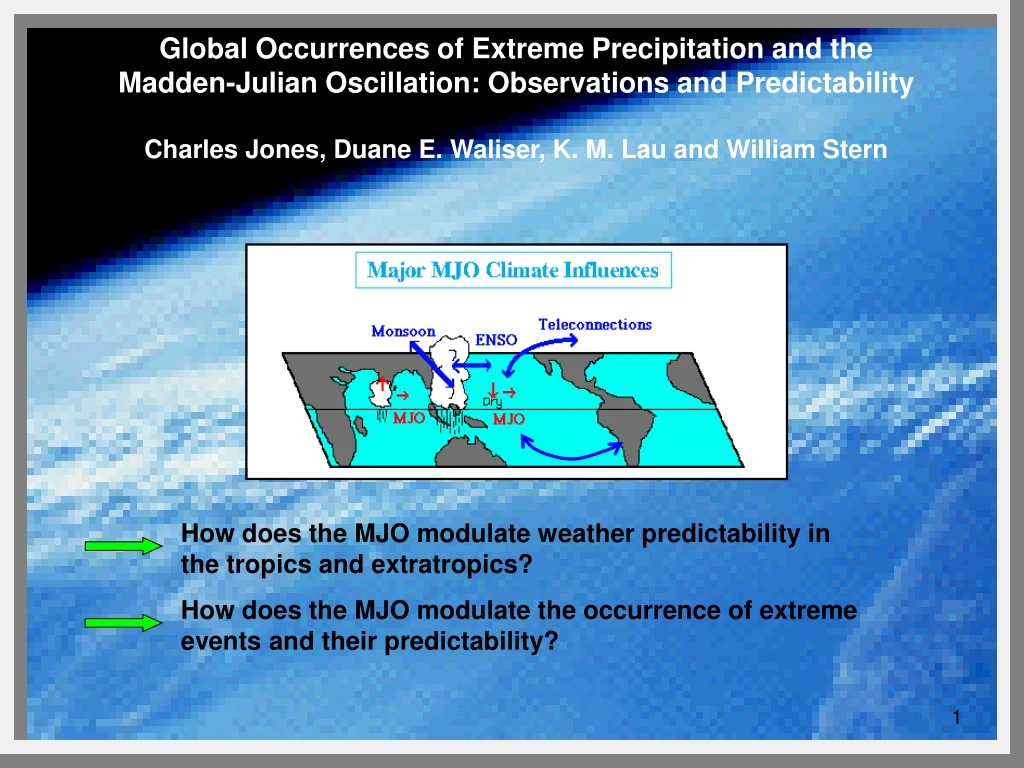
Global Occurrences of Extreme Precipitation and the Madden-Julian Oscillation: Observations and Predictability Charles Jones, Duane E. Waliser, K. M. Lau and William Stern How does the MJO modulate weather predictability in the tropics and extratropics? How does the MJO modulate the occurrence of extreme events and their predictability?
Obtain a global view of the MJO and extreme precipitation events The MJO and Extreme Precipitation: Observations Mo and Higgins (1998) Higgins et al (2000) Jones (2000) Bond and Vecchi (2003) Barlow et al. (2004) Carvalho et al. (2004) Liebmann et al. (2004) Wheeler and Hendon (2004)
MJO • Pentads of OLR 1979-2002 (winter) Filtered 20-90 days anomalies • EOF of OLR anomalies • Active MJO: amplitudes of PC1 and PC2 • Inactive MJO: smooth ( ) inactive: amplitudes ISI below 25th percentile The MJO and Extreme Precipitation: Observations
Global Precipitation Climatology Project (GPCP) pentads 1979-2002 (winter) • Extremes: above 75th percentile • Proportions of extremes • MJO (PC1+, PC1−, PC2+, PC2−):P1k k=1,4 • Inactive MJO: P2 • One-tailed statistical test: • H0: P1k = P2 H1: P1k > P2 Gamma pdf Extreme precipitation events
Only positive values plotted Zk > 1.645 (90% level) Zk > 1.960 (95% level) Extremes more frequent in MJO phase than in inactive MJO Test statistic Zk North America (Mo and Higgins 1998; Higgins et al 2000; Jones 2000; Bond and Vecchi 2003), South America (Carvalho et al. 2004), Southwest Asia (Afghanistan) (Barlow et al. 2004)
Average, min and max P1k and P2 over gridpoints with statistically significant differences
Objective: investigate the modulation of the MJO on potential predictability of extreme events The MJO and Extreme Precipitation: Predictability • Modeling Approach • NASA/GLA model (Kalnay et al. 1983) • Very good performance of MJO representation in AMIP study (Slingo et al. 1996; Sperber et al. 1996) • Ten year control run with climatological SST (Waliser et al. 2003; Jones et al. 2004)
Gamma pdf Extreme precipitation events in the NASA/GLA model GLA 10-yr control run – NH winter Extremes: above 75th percentile
PC1+ PC2- PC1- PC2+ RAINFALL Model MJO • identification of MJO events in 10-yr control run: EEOF of 30-90 day rainfall anomalies • Candidate MJO events and Null cases: amplitudes of EEOF modes 1 and 2 and ISI index Jones et al. (2004a)
Predictability Experiments: Initial Condition Selection Mode 1 > 0 Mode 1 < 0 Mode 2 > 0 Mode 2 < 0 Null • 15 Events Selected • From Each Type • 2 Perturbations • Run for Each Event • Model Integrated for 90 days • Perturbations Added • Were ~ < 5% of • Day-to-Day Variability
Forecast Extremes 75th Percentile Active MJO Control Run c = correct hits; = 14 K = MJO phase m = experiment number Inactive MJO • Sum over all experiments • One-tailed statistical test: • H0: P1k = P2 H1: P1k > P2 ~ ~ ~ ~ MJO modulation on potential predictability of extreme precipitation correct forecasts of extremes IC 14 Days lead time
Only positive values plotted Zk > 1.645 (90%) Zk > 1.960 (95%) Higher frequency of correct forecasts in MJO phase than in inactive MJO Test statistic Zk Jones et al. (2004b)
~ ~ Average, min and max P1k and P2 over gridpoints with statistically significant differences Jones et al. (2004b)
Conclusions • Observations • Higher frequency of extremes during active MJO phases • On a global scale, extreme events during active MJO are about 40% higher than in quiescent phases in locations of statistically significant signals Model Experiments • Overall, the GLA model has a realistic representation of extremes in tropical convective regions associated with the MJO but shortcomings are also present. • Predictability experiments indicate higher success in the prediction of extremes during active MJO than in quiescent situations • Overall, the predictability experiments indicate the mean number of correct forecasts of extremes during active MJO periods to be nearly twice the correct number of extremes during quiescent phases in locations of statistically significant signals • Jones, C., D. E. Waliser, K. M. Lau, and W. Stern, 2004a: The Madden-Julian Oscillation and its Impact on Northern Hemisphere Weather Predictability. Mon. Wea. Rev., 132, 1462-1471 • Jones, C., D. E. Waliser, K. M. Lau, and W. Stern, 2004b: Global occurrences of extreme precipitation events and the Madden-Julian Oscillation: observations and predictability. J. Climate (in press)