Download
1 / 8
80 likes | 247 Views
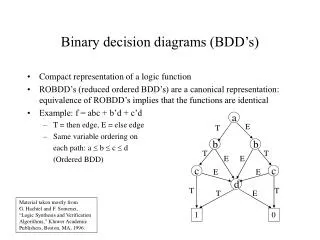
Building Binary Diagrams. An aid in the construction of binary diagrams from experimental data. Click to continue. Given Information:.

E N D
Building Binary Diagrams An aid in the construction of binary diagrams from experimental data. Click to continue
Given Information: Aluminum (melting point 658°C) and Cobalt (melting point 1480°) form three compounds, of which AlCo melts at 1630°C, Al5Co2 decomposes at 1175°C, and Al4Co decomposes at 943°C. A complete series of solid solutions forms from AlCo to pure cobalt. Step 1: 1700 Draw the outline of the binary diagram with the proper scale. Label the two end components. 1500 Step 2: 1300 Draw lightly some guide lines showing the temperature and compositions in the problem. 1100 Step 2 Calculations: 900 AlCo - 1/(1+1) = 50 mol%Co Al5Co2 - 2/(5+2) = 28.6 mol%Co Al4Co - 1/(4+1) = 20 mol%Co 700 Al Co 20 40 60 80 mol% Click to continue
Given Information: Aluminum (melting point 658°C) and Cobalt (melting point 1480°) form three compounds, of which AlCo melts at 1630°C, Al5Co2 decomposes at 1175°C, and Al4Co decomposes at 943°C. A complete series of solid solutions forms from AlCo to pure cobalt. Step 3: Step 4: 1700 Draw intermediate compound and end component lines. Erase guide lines that have been used. Mark the congruent, incongruent, and dissociation points (if given). Do Not Mark In Regions Where Solid Solutions Exist!!!! 1500 1300 Congruent Melting Incongruent Melting Do Not Mark Here at This Time Solid Solution Region 1100 Dissociation (Solids only or Liquids only) 900 700 Al Co 20 40 60 80 mol% Click to continue
Given Information: Aluminum (melting point 658°C) and Cobalt (melting point 1480°) form three compounds, of which AlCo melts at 1630°C, Al5Co2 decomposes at 1175°C, and Al4Co decomposes at 943°C. A complete series of solid solutions forms from AlCo to pure cobalt. Step 5: Determine the peritectic liquid composition for each incongruent melting point using the “Peritectic Reaction.” Example: Consider the incongruent melting point of Al5Co2,which decomposes into a solid and a liquid (from the diagram, the solid is AlCo). Write the reaction: Al5Co2 AlCo + Liq (x # of Al atoms, y # of Co atoms) Balance the reaction: Al5Co2 AlCo + Liq (4 Al, 1 Co) Determine liquid composition: Liq(4Al, 1 Co) 1/(4+1) = 20 mol%Co The same process is used to determine the peritectic reaction and peritectic liquid composition for the incongruent melting point of Al4Co. The resulting peritectic liquid composition is 12.5 mol%Co Click to continue
Given Information: Aluminum (melting point 658°C) and Cobalt (melting point 1480°) form three compounds, of which AlCo melts at 1630°C, Al5Co2 decomposes at 1175°C, and Al4Co decomposes at 943°C. A complete series of solid solutions forms from AlCo to pure cobalt. Step 6: 1700 Mark the location of the peritectic liquids on the diagram. Draw the associated tie-lines. 1500 Use these symbols: 1300 Do Not Mark Here at This Time Solid Solution Region Solid Liquid 1100 Liquid Solid 900 700 Al Co 20 40 60 80 mol% Click to continue
Given Information: Aluminum (melting point 658°C) and Cobalt (melting point 1480°) form three compounds, of which AlCo melts at 1630°C, Al5Co2 decomposes at 1175°C, and Al4Co decomposes at 943°C. A complete series of solid solutions forms from AlCo to pure cobalt. Step 7: 1700 Start to draw the liquidus line. Do Not Draw in the Solid Solution Region!!! Notice that the liquidus line at 12 mol%Co has a positive slope. You may not connect the point to the edge of the diagram as is. You must add an intermediate point which will change the slope of the liquidus line. The only point that does that is an eutectic point. We are not told what the eutectic temperature is and we can not determine its composition. The point must be placed on the diagram somewhere which allows the liquidus line to be drawn. Draw the associated tie-line. 1500 1300 Do Not Mark Here at This Time Solid Solution Region 1100 900 Use this symbol: 700 Al Co 20 40 60 80 mol% Click to continue
Given Information: Aluminum (melting point 658°C) and Cobalt (melting point 1480°) form three compounds, of which AlCo melts at 1630°C, Al5Co2 decomposes at 1175°C, and Al4Co decomposes at 943°C. A complete series of solid solutions forms from AlCo to pure cobalt. Step 8: 1700 Solid Solutions: “Complete series” means “continuous,” no other information has been given (no max. or min.) Refer to Figure 3.11 in the text for an example. Now draw the liquidus and solidus lines in the continuous solid solution region on the diagram 1500 1300 1100 900 700 Al Co 20 40 60 80 mol% Click to continue
Step 9: 1700 Label diagram. 1500 1300 1100 900 Al5Co2 + Al4Co Liq.+ Al 700 Al + Al4Co Al Co 20 40 60 80 mol% Liquid Liq. + ss Liq. + AlCo Continuous Solid Solution (Co, AlCo) Liq. + Al5Co2 Al5Co2 + AlCo Liq. + Al4Co MENU Al4Co Click to repeat