1 / 0

Disasters - Impact and recovery A Case Study New Orleans and Hurricane Katrina Greg Rigamer

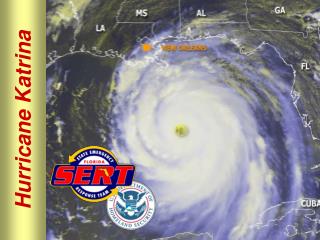
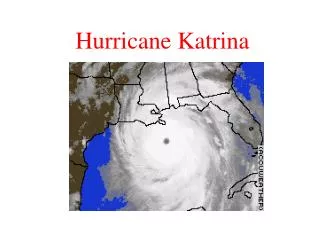
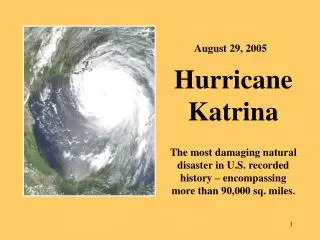
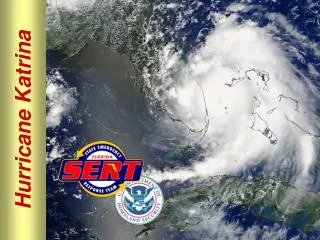
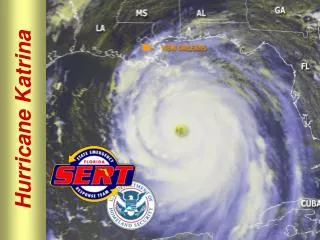
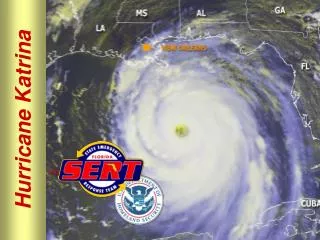
Counselors of Real Estate October 12, 2009. Disasters - Impact and recovery A Case Study New Orleans and Hurricane Katrina Greg Rigamer. Understanding the Situation. In 2005, the US Census Bureau reported that 155,000,000 people, 53% of our population, resided in coastal areas.

candra
Download Presentation

Disasters - Impact and recovery A Case Study New Orleans and Hurricane Katrina Greg Rigamer

An Image/Link below is provided (as is) to download presentation Download Policy: Content on the Website is provided to you AS IS for your information and personal use and may not be sold / licensed / shared on other websites without getting consent from its author. Content is provided to you AS IS for your information and personal use only. Download presentation by click this link. While downloading, if for some reason you are not able to download a presentation, the publisher may have deleted the file from their server. During download, if you can't get a presentation, the file might be deleted by the publisher.

E N D

Presentation Transcript


  1. Counselors of Real Estate October 12, 2009

    Disasters - Impact and recovery A Case StudyNew Orleans and Hurricane KatrinaGreg Rigamer

  2. Understanding the Situation In 2005, the US Census Bureau reported that 155,000,000 people, 53% of our population, resided in coastal areas. The vast majority of coastal communities have no structural protection from storm surges and rely on preparedness and intelligent development practices to mitigate risk. Hurricanes are a common occurrence throughout the Gulf Coast and Atlantic seaboard states – since 2000, 71 hurricanes were reported of which 41 made landfall. Growth of Population Residing in Coastal Areas since 1950 Hurricanes and Landfall since 2000
  3. 2005 – An Active Year In 2005, there were 27 named storms – 12 tropical and 15 hurricanes. 7 hurricanes made landfall. Dennis, Katrina, Rita, and Wilma were the worse – creating havoc throughout the Gulf Coast, causing over $125 billion of damage, and testing all preparedness, protection, and response systems. These storms demonstrated our lack of understanding, respect, and ability to manage catastrophic natural events.
  4. Phenomenal Destruction Communities throughout the Gulf Cost suffered significant loss of life and property. Coastal areas were devastated by high winds, storm surges and flooding. These storms overwhelmed everything in their paths.
  5. Hurricane Katrina Hurricane Katrina was huge: Powerful with sustained winds over 130 mph. Had an incredible surge – over 30 feet at the center and a footprint of 140 miles wide. Produced rain equivalent to the 500 year standard. Katrina was one of the largest and most powerful storms of the 20th Century – far bigger than hurricanes Betsy and Camille. It embodied the energy of 4 atomic bombs and overcame the structural defenses protecting the City of New Orleans. Katrina destroyed over 200 square miles of coastal areas in Louisiana – more than 40% of the loss anticipated for the coming 50 years.
  6. Water and Energy of Katrina While the wind speed was great, the volume of water and the energy it produced was phenomenal. When Katrina’s surge hit land, it was moving well over 3.6 trillion cubic feet of water. Measured in Joules, Katrina’s energy was 27 times that of Hurricane Betsy and nearly 4 times that of Camille.
  7. Mobile 24 – 27’ 22 – 24’ 12 – 14’ 20 – 22’ 10 – 12’ New Orleans 18 – 20’ 14 – 16’ 12 – 14’ 10 – 12’ 14 – 16’ 16 – 18’ 18 – 20’ Katrina Maximum Water Depths Source: IPET Figures 74 & 75 (Volume IV – The Storm (Pages IV-112 and 113)
  8. Maximum Tidal Surge Elevations – Hurricane Katrina Versus Betsy Mobile 10 – 12’ 24 – 28’ 12 – 14’ 20 – 22’ 22 – 24’ 14 – 15’ 12 – 14’ 12 – 14’ 14 – 16’ 10 – 12’ 14 – 16’ 12 – 14’ 12 – 14’ 14 – 15’ 12 – 14’ 12 – 14’ 10 – 12’ 18 – 20’ 12 – 14’ New Orleans 10 – 12’ 16 – 18’ 14 – 15’ 10 – 12’ 10 – 12’ 12 – 14’ Hurricane Betsy Total Hurricane Energy Index = 3.1 GW Hurricane Katrina Total Hurricane Energy Index = 85.5 GW
  9. Maximum Tidal Surge Elevations – Hurricane Katrina Versus Camille Mobile 24 – 28’ 20 – 22’ 22 – 24’ 12 – 14’ 14 – 16’ 10 – 12’ 14 – 16’ 12 – 14’ 12 – 14’ 14 – 15’ 12 – 14’ 18 – 20’ New Orleans 16 – 18’ 10 – 12’ New Orleans 10 – 12’ Hurricane Camille Total Hurricane Energy Index = 23.2 GW Hurricane Katrina Total Hurricane Energy Index = 85.5 GW
  10. Preventable Damage The impact of a storm like Katrina could never be fully prevented; however, it could be mitigated. Of the over 100 billion dollars of damage, approximately $40 billion can be attributed to levee breaches and environmental deterioration. Beyond the direct impact, the long term consequences of the storm in the New Orleans metropolitan area will prove to be costly and significant.
  11. 24 - 27’ 22 - 24’ 20 - 22’ 18 - 20’ 16 - 18’ 14 - 16’ 12 - 14’ 16’ In River 10 – 12’ At Lakefront >4.0’ <3.0’ >3.0’ 3.0’ >3.0’ 15’ In River <3.0’ Katrina Maximum Water Depths
  12. Damage to Residences Nearly 1,200,000 homes were damaged by Katrina – of this amount, 43% were in Louisiana. Throughout the impact area, 26% of all damage was Major or Severe in contrast to 40% in LA and 78% in New Orleans. Flooding was clearly the primary cause of Major or Severe damage but particularly in LA where it accounted for 83% and in New Orleans where it was over 95%.
  13. August 31, 2005 Katrina Flooding
  14. “The flood did not discriminate by race or class. It did discriminate historically: it took out everything but the old city. If you asked an architecture critic…to design a flood of this size in New Orleans, he would have given you something like this one.” -Michael Lewis, The New York Times, October 9, 2005 The Hardee Map of 1878 displays the layout of New Orleans when the city’s population was about 203,000. Areas developed and settled since then were affected severely by post-Katrina flooding.
  15. Legend for Map Series The following slides illustrate resettlement patterns in the City on a biannual basis from January 2006 through January 2009. These maps demonstrate how repopulation has radiated outward from areas which recovered quickly after the storm. In each of these maps,red represents areas in which activity is less than 20%of its pre-Katrina level. Green represents areas in which activity is greater than 80%of its pre-Katrina level. Yellow and orange display areas in transition between these levels. Boundaries of New Orleans City Council Districts are also displayed.
  16. Repopulation, January 2006
  17. Repopulation, July 2006
  18. Repopulation, January 2007
  19. Repopulation, July 2007
  20. Repopulation, January 2008
  21. Repopulation, July 2008
  22. Repopulation, January 2009
  23. Repopulation, July 2009
  24. Vacant or Abandoned Properties in Gentilly Estimated Single Family Home Value = $177,960 (assumes in livable condition) 6,502 units occupied pre-Katrina but now vacant. Source: www.city-data.com, GCR & Associates, Inc.
  25. Major Challenges While the recovery of the region and particularly the City of New Orleans is progressing better than many national experts originally predicted, there are significant challenges that must be addressed as we move forward. Demonstrative Progress • 77% of pre-storm population • 71% of pre-storm job figures • 77% of pre-storm commercial activity • $5 Billion invested in 68,000 housing units • $15 Billion in improved hurricane protection • 80,000 jobs lost in the metro area • 50% increase in rents • More than 60,000 vacant homes • Damaged infrastructure • Diminished services • Minimal private investment
  26. Population The Metropolitan Area has 88% of its pre storm population Jefferson Parish is back to pre-storm levels St. Tammany, St. Charles and St. John the Baptist Parishes have grown Orleans, Plaquemines and St. Bernard Parishes have substantially fewer residents Source: U.S. Census and GCR & Associates, Inc. using data provided by Entergy Louisiana and ESRI, Inc.
  27. Key Stats for New Orleans The City of New Orleans continues to recover Approximately 77% of its pre-storm population has returned While very high, vacant residential properties continue to be absorbed Over 70% of the jobs based in Orleans Parish have returned Commercial activity is currently at 76% of pre-storm levels While increasing, school enrollment continues to lag other indicators
  28. Blight is a Problem*Red parcels indicate a vacant home or empty lot Estimated Single Family Home Value = $177,960 6,502 units occupied pre-Katrina but now vacant. Estimated Single Family Home Value = $395,442 3,875 units occupied pre-Katrina but now vacant. Gentilly Lakeview
  29. Rents have Increased Fair Market Rent for a 2-Bedroom Unit
  30. Affordability Issues Housing Affordability Gap for Top Ten In-Demand Occupations Source: Louisiana Workforce Commission, Spring 2009, HUD-published Fair Market Rents for 2009, and Low Income Housing Tax Credit rent limits for New Orleans MSA provided by Novogradac and Company, LLP
  31. Job Loss is an Impediment Employment by Industry for New Orleans MSA Source: Louisiana Workforce Commission
  32. Emerging Trends Growing civic interest and participation Emerging community of young, civic-minded professionals Burgeoning health care and film industries “Green” Movement Improving public education Many centrally located mixed income housing developments
  33. Growing Concerns Blighted and abandoned homes Post recovery economic drivers Stagnant job growth Many residents do not have the financial means to rebuild Limited access to affordable healthcare, childcare and transportation A high and unabating crime rate Confidence in our hurricane protection and loss of coastal areas
  34. What the Future Holds While the population of the City will continue to grow, it will likely not reach pre-Katrina levels in the near future Our capacity to absorb or redevelop blighted and abandoned homes will pace the recovery in many neighborhoods As our population continues to grow, we move closer to our pre storm demographic profile With more than $20 billion in new investments, the city has the potential to emerge as a stronger, more resilient and economically diverse community
  35. For more information: Gregory C. Rigamer grigamer@gcrConsulting.com 2021 Lakeshore Drive, Ste. 500 New Orleans, LA 70122 800.259.6192 | 504.304.2500 www.gcrConsulting.com
More Related