Download
1 / 37
370 likes | 537 Views
Space Research Centre. Regional Air Quality and Climate from Space – A reality?. Paul Monks & John Remedios. UK Ozone Bubble – 2pm 6 th August 2003. Over Europe estimates are between 22,000 and 44,000 excess deaths. 2003 summer heatwave.

E N D
Space Research Centre Regional Air Quality and Climate from Space – A reality? Paul Monks & John Remedios
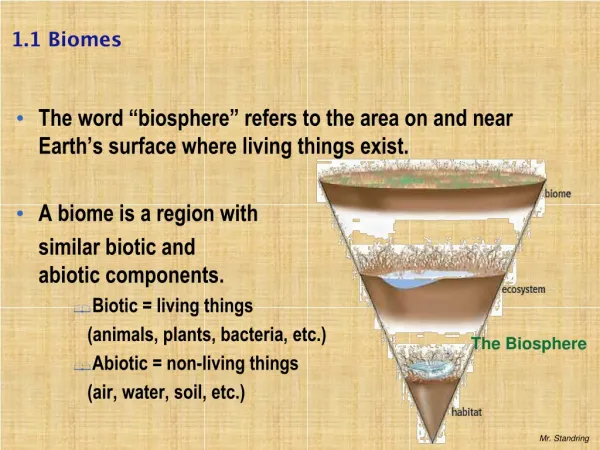
UK Ozone Bubble – 2pm 6th August 2003 Over Europe estimates are between 22,000 and 44,000 excess deaths 2003 summer heatwave • In the UK, 2000 excess deaths during heatwave • 700 may have been attributable to high levels of ozone and PM10 • 20-40% of all excess U.K. deaths in that period.
Satellites In situ Ground based remote sensing
In Situ Monitors 1 MET . Station 5 2 6 8 7 9 4 CMAX-DOAS 3 Run by Leicester City Council - Hourly averaged NO2 concentrations (ppb). 2 km
CMAX-DOAS Coated Glass Plano -convex lens Fibre-optic to Spectrometer 15o 10o 90o 5o 2o
All city centre monitoring stations show similar diurnal variation. • Stations situated close to the roadside are influenced by traffic. • Mean average and variability of NO2 from monitoring stations calculated. Corr. coeff = 0.53
Satellites In situ Ground based remote sensing
OMI • The Ozone Monitoring Instrument (OMI) was launched onboard the NASA EOS Aura satellite in July 2004. • OMI is a Nadir viewing spectrometer that measures in the spectral range between 270 and 500 nm. • Has a spectral resolution of 0.52 and 0.45 nm in the UV-1 and UV-2 channels and 0.63 nm in the visible channel. • OMI has a large swath width of 2600 km, to obtain this viewing swath the viewing angle is 114° • In the normal operation mode, the OMI pixel size is 13 x 24 km2 making it suitable for comparisons with measurements on an urban scale.
Mean average and variability of NO2 from all monitoring stations in Leicester.
NS(NO2)Total = NS(NO2)Leic-NS(NO2)bkg R=0.60-0.83 (green =0.04) Correlation between OMI NO2 concentration in the PBL and the mean near-surface NO2 concentrations across the OMI sampling area, for January 2005 to December 2006. The different symbols represent the seasons, autumn (black circles), winter (green stars), spring (red triangles) and summer (blue crosses).
Weekly cycle For each day of the week the mean is calculated and normalised to the median weekly value. A weekly cycle is evident with 20-30% lower NO2 vertical column densities observed on Sunday and a 10 % reduction on a Saturday.
Conclusions • Space-based observations have a role to play as part of a system for air quality. • Provide a synoptic view not available from ground-based systems • Need for greater temporal coverage • Need to be careful in linking different observing systems together. Considerations include spatial structure, site characteristics of in situ stations, timing of measurements.
Acknowledgements Thanks to the following: • John Remedios • James Lawrence • Leicester City Council: Evan Davies Paul Hodges • OMI validation team • NERC If you would like more information: Leigh, R. J., G. K. Corlett, U. Frieß, and P. S. Monks (2006), A Concurrent Multi-Axis Differential Optical Absorption Spectroscopy system for the Measurement of Tropospheric Nitrogen Dioxide., Appl. Opt. , 45, 7504-7518. Louisa J. Kramer, Roland J. Leigh, John J. Remedios and Paul S. Monks (2008), Comparison of OMI and ground based in-situ and MAX-DOAS measurements of tropospheric nitrogen dioxide in an urban area, In press J.Geophys.Res.
The Compact Air Quality Spectrometer Breadboard demonstrator constructed and under testing as part of CEOI phase 1 Novel spectrometer designed by SSTL for space borne UV/VIS spectroscopy
Performance • Single Channel – 300 - 450nm • Spectral resolution – 0.6 nm FWHM. • Resolution from LEO – 5x5km sub-satellite. • Full Payload Mass – 20kg • Full Payload Power – 30W • Full Payload Volume - 30 x 20 x 20 cm. • High spatial resolution available from LEO in a compact package. • Coverage and temporal components offered by constellation
Carbon Dioxide Can we monitor the Carbon Budget from Space?
The FSI algorithm: Overview How do we measure atmospheric CO2? WFM-DOAS retrieval technique (Buchwitz et al., JGR, 2000) designed to retrieve the total columns of CH4,CO, CO2, H2O and N2O from spectral measurements in NIR made by SCIAMACHY Least squares fit of model spectrum + ‘weighting functions’ to observed sun-normalised radiance We use WFM-DOAS to derive CO2 total columns from absorption at ~1.56 μm Key difference to Buchwitz’s approach: No look-up table Calculate a reference spectrum for every single SCIAMACHY observation i.e. to obtain ‘best’ linearization point – no iterations See “Measuring atmospheric CO2 using Full Spectral Initiation (FSI) WFM-DOAS” , Barkley et al., ACP, 6, 3517-3534,2006 Computationally expensive Increased accuracy SCIAMACHY SCIAMACHY, on ENVISAT, is a passive hyper-spectral grating spectrometer covering in 8 channels the spectral range 240-2040 nm at a resolution of 0.2-1.4 nm Typical pixel size = 60 x 30 km2
Cloud Filter SPICI (SRON) (Krijger et al, ACP, 2005) ‘A priori’ Data CO2 profiles taken from climatology (Remedios, ULeic) ECMWF: temperature, pressure and water vapour profiles ‘A priori’ albedo - inferred from SCIAMACHY radiance as a f(SZA) ‘A priori’ aerosol (maritime/rural/urban) SCIAMACHY Spectra, geolocation, viewing geometry, time Raw Spectra Process only if : cloud free, forward scan, SZA ‹75 SCIATRAN (Courtesy of IUP/IFE Bremen) LBL mode, HITRAN 2004 Calibration Non-linearity, dark current, ppg & etlaon I - Calibrated Spectra I0 – Frerick (ESA) Reference Spectrum + weighting functions (CO2, H2O and temperature) SCIAMACHY Spectrum (I/I0) WFM-DOAS fit CO2 Column (Normalise with ECMWF Surface Pressure) Accept only: Errors <5%, Range:340-400 ppmv Note: No scaling of FSI data
Precision - Validation Summary FTIR Park Falls ~ -2% Egbert ~ -4% TM3 Bias ~ -2% SCIAMACHY overestimates seasonal cycle by factor 2-3 with respect to the TM3 – reason? Bias of TM3 w.r.t Egbert FTIR data ~ -2% Aircraft – collocated observations in time & space Sites over Siberia (r2 > 0.72-0.9) Best at 1.5 km Surface Sites - monthly averages Time series comparisons (inc. aircraft) Out of 17, 11 have r2 > 0.7
Collocated on same day within +/- 5 deg lon/lat of site 2nd panel: horizontal lines = +/- 5 ppmv difference 3rd panel: horizontal lines = +/- 2% bias
Surgut Better agreement at 1.5-2.0 km SCIAMACHY = Red Aircraft = Black
Can we learn anything? • Greater CO2 uptake by forests compared to crops & grass plains? • Identification of sub-continental CO2 sources/sinks?
xvid_1fps.avi Global CO2 (5% error video)
Conclusions Space-based observations have a role to play as part of a system for climate. First views of carbon dioxide from space seem to be approaching the accuracy to look at natural variability [Trends in carbon dioxide also look good] First (tentative) steps to identify surface sources/sinks Regional (continental scale) studies appropriate since global data quality is variable Future missions may allow estimates of man-made emissions.
Thanks to… UdoFrieß Institute of Environmental Physics, Heidelberg, Germany John Burrows, V. Rozanov Institute of Environmental Physics, U. Bremen, Germany R. L. Mittermeier and H. Fast Meteorological Service of Canada (MSC), Ontario, Canada R. Washenfelder, G. Aleks, G. Toon., P.Wennberg NASA JPL & Caltech, USA. T. Machida NIES, Japan S. Körner and M. Heimann Max Planck Institute for Biogeochemistry (MPI-BGC), Jena, Germany Richard Engelen European Centre for Medium-Range Weather Forecast, Reading, UK