Download
1 / 12
130 likes | 319 Views
EDUC 200C Two sample t-tests. November 9, 2010. Review : What are the following?. Sampling Distribution Standard Error of the Mean Central Limit Theorem Confidence Interval Standard Error of the difference between the means Pooled variance.

E N D
EDUC 200CTwo sample t-tests November 9, 2010
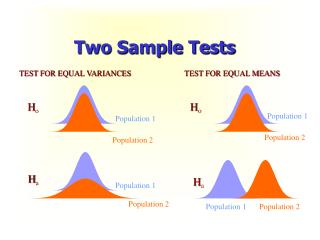
Review: What are the following? • Sampling Distribution • Standard Error of the Mean • Central Limit Theorem • Confidence Interval • Standard Error of the difference between the means • Pooled variance
20 samples randomly drawn from a population with mean = 0 and sd = 2 N = 5 N = 10 N = 20 N = 50
As the number of samples increases, the distribution of sample means approaches a normal distribution with a mean equal to the population mean 10 Samples 20 Samples 50 Samples 100 Samples
Practice Problem 1 • A high school social studies teacher decides to conduct action research in her classroom by investigating the effects of immediate testing on memory. She randomly divides her class into two groups. Group 1 studies a short essay for 20 minutes, while group 2 studies the essay for 20 minutes and then immediately takes a 10-minutes test on the essay. The results below are from a final exam on the essay, taken one month later: • Set up the appropriate statistical hypotheses • Perform the test (α=0.05) • Draw final conclusions.
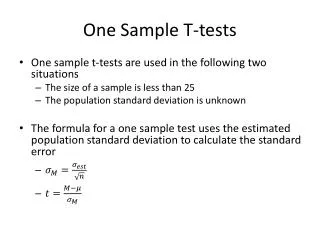
Independent sample t-tests • So far, we’ve talked about and calculated the difference in the mean of a certain variable between two independent populations. • Here, “independent” tells us that there was no connection between the two groups we were comparing • Our test statistic took the form • This allowed us to make claims about how the mean of one population compared to the mean of the other.
Matched pairs t-tests • Used when the observations are not independent • Same person measured twice • Relevant connection between observation (e.g. parents and children) • Observations deliberately matched on particular attributes (e.g. intelligence) • Tells whether the mean difference within observations is significantly different from the null hypothesis value (usually 0).
Matched pairs t-statistic • Based on how we’ve constructed our tests of significance so far, how would we go about testing a matched pairs hypothesis?
Stata • Performing a matched pairs t-test is the same as performing and independent samples t-test, just leave off the “unpaired” option ttest var1==var2