Download
1 / 24
240 likes | 421 Views
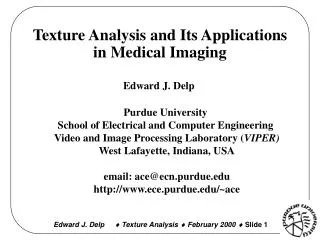
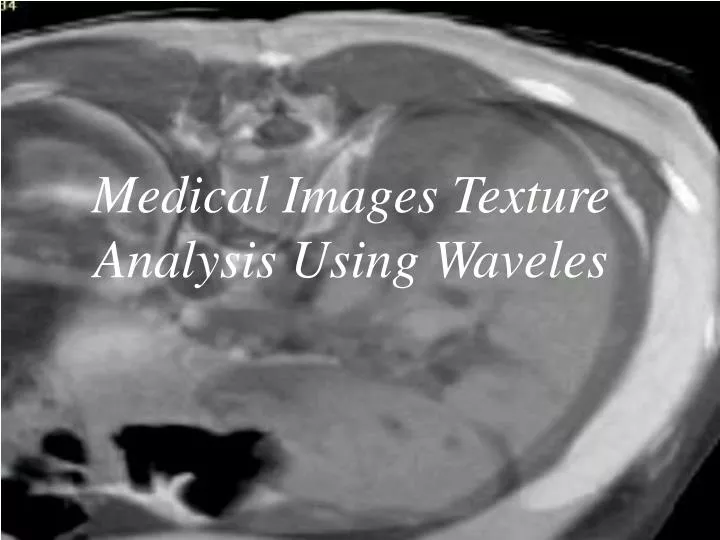
Medical Images Texture Analysis Using Waveles. Why Texture Analysis?. Method for differentiation between normal and abnormal tissue. Contrast between malignant tissue and normal tissue may be present but below the threshold of human perception.

E N D
Why Texture Analysis? • Method for differentiation between normal and abnormal tissue. • Contrast between malignant tissue and normal tissue may be present but below the threshold of human perception. • Avoid biopsy intervention to identify the tissue. • Diagnosis (early!!!!) and tracking of diseases. (Diffuse diseases).
How to do it? ….image processing • Techniques to extract image features and enhances these features with respect to their surroundings…. ……Statistical, Fuzzy Logic, Fourier, Wavelets…
Why Use Wavelets? • ……. • ……Wavelet-based processing algorithms were superior….Ability of wavelets to discriminate different frequencies and to preserve signal details at different resolutions. …‘zoom in’ and ‘zoom out’ capability of the wavelet filters which can translate themeselves to a location of a signal that is of interest and dilate themselves properly to preserve the resolution of that portion of the signal.[3]
S=aφ+dψ 2D Wavelets a LoD 2 M d HiD 2
Applications • Detection of Microcalcifications in Digital Mammograms. • Characterization of Liver tissue. • MR Image texture analysis.
Detection of Microcalcifications in Digital Mammograms (2) • MC presents but difficult to identify. (malignant MC tend to be smaller < 1mm²), hidden in low contrast image. • X rays highly attenuated by MC, witch correspond to the high frequencies variation.
Detection of Microcalcifications in Digital Mammograms(3) • Using BAUBECHIES Wavelet Filters (try Matlab db4) • Decomposition level 2 • MC correspond to highest frequencies • Set the background signal to zero (lowest frequencies) • Reconstruct the image
Detection of MC in …Some lifting (4) • Visibility is improved by using nonlinear thresholding (nonlinear mapping based on arc-tangent). • Try Matlab!!!
Detection of MC Organigram (5) Some Matlab functions: imread: load the image (rgb2gray may be usefull in case of rgb images). Wavedec2: 2D wavelet decomposition Waverec2: 2D wavelet reconstruction
Detection of MC in … Discussion(7) • The resolution of the original digital mammogram • Intensity contrast (S/N??) • Artifacts!!! • Wavelet Selection • Effect of threshold.
Characterization of Liver tissue(1) • Using nonseparable Wavelet. Quincunx transform: nonseparable and nonoriented filters. • Filter based on McClellan transform. Diamond-shape.[1]
Characterization of Liver tissue(2) Texture Feature Extraction • Low-pass filter will preserve more of the original signal. • Iterated filter bank could provide more reliable description of texture.
Characterization of Liver tissue(3) Texture Feature Extraction
Characterization of Liver tissue(4) Texture Feature Extraction • Image and subimages after Wavelet multi level decomposition • N=3
Characterization of Liver tissue(5) Texture Feature Extraction • Calculate for the original image and subimages: e (simulate energy) Σ I2(x,y) e = Nb of pixels • Feature vector (e1,e2,e3,e4,e5)
Characterization of Liver tissue(6) Texture Feature Extraction • Classification: -Assume normal distribution. - Estimate the mean and the covariance for each texture class. Ci and Mi -Use Bayes distance (minimum error): D(X,i)= (X-i)TCi-1(X-Mi) +log( |Ci|) Normal Abnormal
Characterization of Liver tissue(7) Organigram Using Matlab:Wavelet decomposition level: 4 For 2 classes (1 normal and 1 sick).
Characterization of Liver tissue(8) Organigram Training the system:
Characterization of Liver tissue(9) Organigram Testing the system:
Characterization of Liver tissue(10)Discussion • Choice of Wavelet. (Sensitivity to rotation) • Choice of samples. (noise, blood vessels, location • Classification methods: Sophisticated formula Fuzzy Logic, evidence theory (Dempster-Shafer)…
References [1]G. Strang and T. Nguyen, Wavelets and filters banks. [2] M. Misiti, Les ondelettes et leurs applications. [3] Ted C. Wang and Nicolas B. Karayiannis. Detection of microcalcifications in digital mammograms using wavelets. IEEE Trans. on Medical Imaging, vol. 17, no. 4, August 1998. [4] A. Mojsilovic, M. Popovic, "Characterization of visually similar diffuse diseases from B-scan liver images using the nonseparable wavelet transform", IEEE Trans. on Medical Imaging, vol. 17, no. 4, August 1998. [5] Peter A. Freeborough and Nick C. Fox. MR Image texture analysis to the diagnosis and tracking of Alzheimer’s disease. IEEE Trans. on Medical Imaging, vol. 17, no. 3, August 1998.