Download
1 / 1

E N D
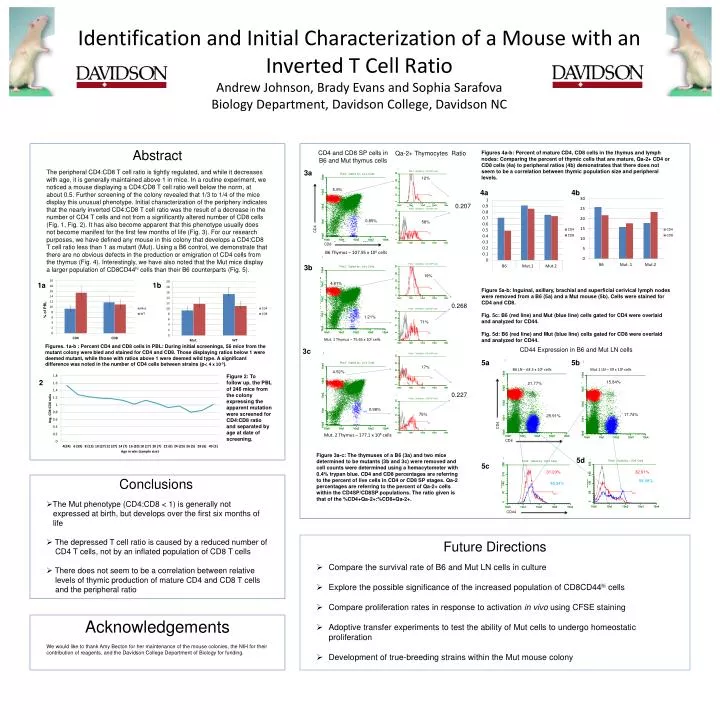
Abstract The peripheral CD4:CD8 T cell ratio is tightly regulated, and while it decreases with age, it is generally maintained above 1 in mice. In a routine experiment, we noticed a mouse displaying a CD4:CD8 T cell ratio well below the norm, at about 0.5. Further screening of the colony revealed that 1/3 to 1/4 of the mice display this unusual phenotype. Initial characterization of the periphery indicates that the nearly inverted CD4:CD8 T cell ratio was the result of a decrease in the number of CD4 T cells and not from a significantly altered number of CD8 cells (Fig. 1, Fig. 2). It has also become apparent that this phenotype usually does not become manifest for the first few months of life (Fig. 3). For our research purposes, we have defined any mouse in this colony that develops a CD4:CD8 T cell ratio less than 1 as mutant (Mut). Using a B6 control, we demonstrate that there are no obvious defects in the production or emigration of CD4 cells from the thymus (Fig. 4). Interestingly, we have also noted that the Mut mice display a larger population of CD8CD44hi cells than their B6 counterparts (Fig. 5). CD4 and CD8 SP cells in B6 and Mut thymus cells Qa-2+ Thymocytes Ratio Figures 4a-b: Percent of mature CD4, CD8 cells in the thymus and lymph nodes: Comparing the percent of thymic cells that are mature, Qa-2+ CD4 or CD8 cells (4a) to peripheral ratios (4b) demonstrates that there does not seem to be a correlation between thymic population size and peripheral levels. 3a 12% 5.9% 4a 4b 0.207 CD4 0.85% 58% Identification and Initial Characterization of a Mouse with an Inverted T Cell RatioAndrew Johnson, Brady Evans and Sophia SarafovaBiology Department, Davidson College, Davidson NC CD8 B6 Thymus – 107.95 x 10⁶ cells 3b 19% 1a 1b 4.81% Figure 5a-b: Inguinal, axillary, brachial and superficial cerivical lymph nodes were removed from a B6 (5a) and a Mut mouse (5b). Cells were stained for CD4 and CD8. Fig. 5c: B6 (red line) and Mut (blue line) cells gated for CD4 were overlaid and analyzed for CD44. Fig. 5d: B6 (red line) and Mut (blue line) cells gated for CD8 were overlaid and analyzed for CD44. % of PBL 0.268 1.21% 71% Mut. 1 Thymus – 75.65 x 10⁶ cells Figures. 1a-b : Percent CD4 and CD8 cells in PBL: During initial screenings, 56 mice from the mutant colony were bled and stained for CD4 and CD8. Those displaying ratios below 1 were deemed mutant, while those with ratios above 1 were deemed wild type. A significant difference was noted in the number of CD4 cells between strains (p< 4 x 10⁻⁵). CD44 Expression in B6 and Mut LN cells 3c 5a 5b 17% B6 LN – 63.5 x 10⁶ cells Mut 1 LN – 39 x 106 cells 4.52% Figure 2: To follow up, the PBL of 246 mice from the colony expressing the apparent mutation were screened for CD4:CD8 ratio and separated by age at date of screening. 2 15.84% 21.77% 0.227 0.98% 75% 17.74% 25.91% CD4 Mut. 2 Thymus – 177.1 x 10⁶ cells CD8 Figure 3a-c: The thymuses of a B6 (3a) and two mice determined to be mutants (3b and 3c) were removed and cell counts were determined using a hemacytometer with 0.4% trypan blue. CD4 and CD8 percentages are referring to the percent of live cells in CD4 or CD8 SP stages. Qa-2 percentages are referring to the percent of Qa-2+ cells within the CD4SP/CD8SP populations. The ratio given is that of the %CD4+Qa-2+:%CD8+Qa-2+. 5d 5c 31.23% 32.91% Conclusions 58.08% 48.34% • The Mut phenotype (CD4:CD8 < 1) is generally not • expressed at birth, but develops over the first six months of • life • The depressed T cell ratio is caused by a reduced number of • CD4 T cells, not by an inflated population of CD8 T cells • There does not seem to be a correlation between relative • levels of thymic production of mature CD4 and CD8 T cells • and the peripheral ratio CD44 Future Directions • Compare the survival rate of B6 and Mut LN cells in culture • Explore the possible significance of the increased population of CD8CD44hi cells • Compare proliferation rates in response to activation in vivo using CFSE staining • Adoptive transfer experiments to test the ability of Mut cells to undergo homeostatic proliferation • Development of true-breeding strains within the Mut mouse colony Acknowledgements We would like to thank Amy Becton for her maintenance of the mouse colonies, the NIH for their contribution of reagents, and the Davidson College Department of Biology for funding.