Download
1 / 34
340 likes | 452 Views
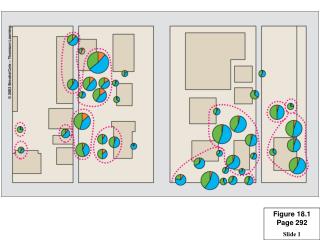
3 Automatic safety devices that shut down the reactor when water and steam levels fall below normal and turbine stops were shut off because engineers didn’t want systems to “spoil” experiment. Figure 17-1 Page 350. 2 Almost all control rods were removed from the

E N D
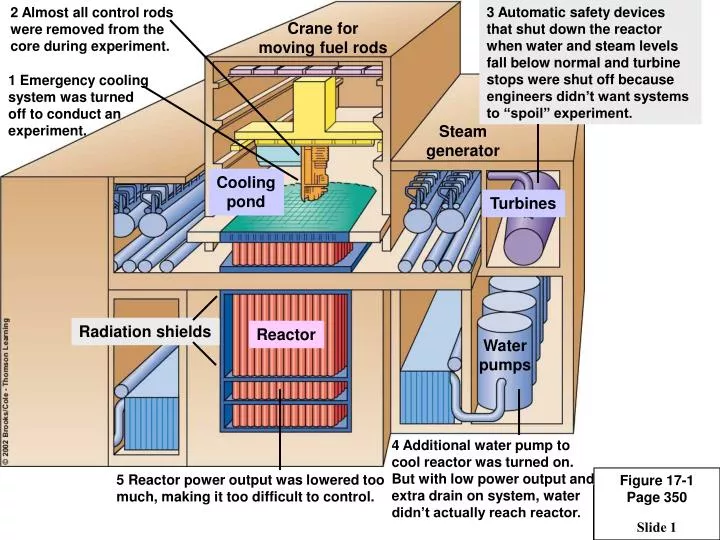
3 Automatic safety devices that shut down the reactor when water and steam levels fall below normal and turbine stops were shut off because engineers didn’t want systems to “spoil” experiment. Figure 17-1Page 350 2 Almost all control rods were removed from the core during experiment. 1 Emergency cooling system was turned off to conduct an experiment. Cooling pond Cooling pond Turbines Turbines Radiation shields Radiation shields Reactor Reactor 5 Reactor power output was lowered too much, making it too difficult to control. Crane for moving fuel rods Steam generator Water pumps 4 Additional water pump to cool reactor was turned on. But with low power output and extra drain on system, water didn’t actually reach reactor.
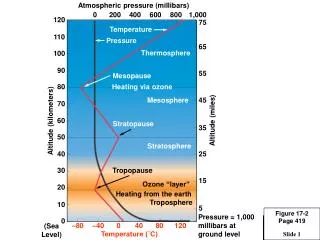
Figure 17-2Page 351 Coal seam Oil and Natural Gas Coal Geothermal Energy Hot water storage Contour strip mining Floating oil drilling platform Oil storage Geothermal power plant Oil drilling platform on legs Area strip mining Pipeline Pipeline Oil well Drilling tower Mined coal Gas well Valves Water penetrates down through the rock Pump Underground coal mine Water is heated and brought up as dry steam or wet steam Impervious rock Natural gas Oil Hot rock Water Water Magma
Figure 17-3aPage 352 Nuclear power 6% Hydropower, geothermal, solar, wind 6% Natural Gas 22% RENEWABLE 16% Biomass 10% Coal 23% Oil 33% NONRENEWABLE 84% World
Figure 17-3bPage 352 Nuclear power 8% Hydropower geothermal solar, wind 3% Natural Gas 24% RENEWABLE 6% Coal 23% Oil 39% Biomass 3% NONRENEWABLE 94% United States
Figure 17-4Page 352 60 History Projections Oil 50 Natural gas 40 Coal Energy consumption (quadrillion Btus) Nuclear 30 Nonhydro renewable 20 Renewable hydro 10 0 1970 1980 1990 2000 2010 2020 Year
Figure 17-5Page 353 60 History Projections Oil 50 Natural gas 40 Coal Nuclear Energy consumption (quadrillion Btus) 30 Nonhydro renewable 20 Renewable hydro 10 0 1970 1980 1990 2000 2010 2020 Year
Figure 17-6Page 353 100 Wood Coal 80 Natural gas 60 Contribution to total energy consumption (percent) Oil 40 Hydrogen Solar 20 Nuclear 0 1800 1875 1950 2025 2100 Year
Space Heating Figure 17-7aPage 354 Passive solar 5.8 Natural gas 4.9 Oil 4.5 Active solar 1.9 Coal gasification 1.5 Electric resistance heating (coal-fired plant) 0.4 Electric resistance heating (natural-gas-fired plant) 0.4 Electric resistance heating (nuclear plant) 0.3
Figure 17-7bPage 354 High-Temperature Industrial Heat 28.2 Surface-mined coal Underground-mined coal 25.8 Natural gas 4.9 Oil 4.7 Coal gasification 1.5 Direct solar (highly concentrated by mirrors, heliostats, or other devices) 0.9
Figure 17-7cPage 354 Transportation Natural gas 4.9 Gasoline (refined crude oil) 4.1 Biofuel (ethyl alcohol) 1.9 Coal liquefaction 1.4 Oil shale 1.2
Figure 17-8Page 356 Heated crude oil Gases Gasoline Aviation fuel Heating oil Diesel oil Naphtha Grease and wax Furnace Asphalt
Arctic Ocean Figure 17-9Page 357 Arctic National Wildlife Refuge Trans Alaska oil pipeline Prince William Sound Prudhoe Bay Coal Beaufort Sea ALASKA Gas Oil Valdez High potential areas Gulf of Alaska CANADA Grand Banks Pacific Ocean UNITED STATES Atlantic Ocean MEXICO
Figure 17-10Page 357 LOUISIANA GEORGIA ALABAMA MISSISSIPPI TEXAS FLORIDA GULF OF MEXICO Active drilling sites
Figure 17-11Page 358 70 60 50 40 Oil price per barrel 30 20 (1997 dollars) 10 0 1950 1960 1970 1980 1990 2000 2010 Year
Figure 17-12Page 358 30 Projections History 25 20 Net imports Consumption Oil (million barrels per day) 15 10 Domestic supply 5 0 1970 1980 1990 2000 2010 2020 Year
Figure 17-13Page 359 History Projections 120 100 80 Total Oil (million barrels per day) 60 Developed 40 Developing 20 0 1970 1980 1990 2000 2010 2020 Year
Figure 17-14Page 360 Trade-Offs Drilling for Oil and Natural Gas In Alaska’s Arctic National Wildlife Refuge Advantages Disadvantages Only 19% of finding oil equal to what U.S. consumes in 7-24 months Too little potential oil to significantly reduce oil imports Costs too high and potential oil supply too little to lower energy prices Studies show considerable oil spills and other environmental damage from Alaskan oil fields Potential degradation of refuge not worth the risk Unnecessary if improved slant drilling allows oil to be drilled from outside the refuge Could increase U.S oil and natural gas supplies Could reduce oil imports slightly Would bring jobs and oil revenue to Alaska May lower oil prices slightly Oil companies have developed Alaskan Oil fields without significant harm New drilling techniques will leave little environ- mental impact
Figure 17-15Page 360 Trade-Offs Conventional Oil Advantages Disadvantages Ample supply for 42-93 years Low cost (with huge subsidies) High net energy yield Easily transported within and between countries Low land use Technology is well developed Efficient distribution system Need to find substitute within 50 years Artifically low price encourages waste and discourages search for alternative Air pollution when burned Releases CO2 when burned Moderate water pollution
Figure 17-16Page 361 286% Coal-fired electricity Synthetic oil and gas produced from coal 150% 100% Coal 92% Oil sand 86% Oil 58% Natural gas 17% Nuclear power
Figure 17-18Page 362 Trade-Offs Heavy Oils from Oil Shale and Oil Sand Advantages Disadvantages High cost (oil shale) Moderate cost (oil sand) Low net energy yield Large potential supplies, especially oil sands in Canada Large amount of water needed for processing Severe land disruption from surface mining Easily transported within and between countries Water pollution from mining residues Efficient distribution system in place Air pollution when burned Technology is well developed CO2 emissions when burned
Figure 17-19Page 363 Trade-Offs Conventional Natural Gas Advantages Disadvantages Ample supplies (125 years) Nonrenewable resource High net energy yield Releases CO2 when burned Methane (a greenhouse gas) can leak from pipelines Low cost (with huge subsidies) Less air pollution than other fossil fuels Difficult to transfer from one country to another Lower CO2 emissions than other fossil fuels Shipped across ocean as highly explosive LNG Moderate environmental impact Sometimes burned off and wasted at wells because of low price Low land use Easily transported by pipeline Requires pipelines Good fuel for fuel cells and gas turbines
Figure 17-20Page 364 Increasing heat and carbon content Increasing moisture content Peat (not a coal) Lignite (brown coal) Bituminous Coal (soft coal) Anthracite (hard coal) Heat Heat Heat Pressure Pressure Pressure Partially decayed plant matter in swamps and bogs; low heat content Low heat content; low sulfur content; limited supplies in most areas Extensively used as a fuel because of its high heat content and large supplies; normally has a high sulfur content Highly desirable fuel because of its high heat content and low sulfur content; supplies are limited in most areas
Figure 17-21Page 365 Trade-Offs Coal Advantages Disadvantages Ample supplies (225–900 years) Very high environmental impact Severe land disturbance, air pollution, and water pollution High net energy yield Low cost (with huge subsidies) High land use (including mining) Mining and combustion technology well-developed Severe threat to human health High CO2 emissions when burned Air pollution can be reduced with improved technology (but adds to cost) Releases radioactive particles and mercury into air
Figure 17-22Page 365 Trade-Offs Synthetic Fuels Advantages Disadvantages Large potential supply Low to moderate net energy yield Higher cost than coal Vehicle fuel Requires mining 50% more coal High environmental impact Moderate cost (with large government subsidies) Increased surface mining of coal High water use Lower air pollution when burned than coal High CO2 emissions when burned
Figure 17-23Page 367 Small amounts of radioactive gases Uranium fuel input (reactor core) Containment shell Emergency core cooling system Control rods Heat exchanger Hot coolant Hot coolant Coolant Coolant Moderator Coolant passage Pressure vessel Shielding Waste heat Electrical power Steam Useful energy 25 to 30% Generator Turbine Hot water output Condenser Pump Pump Cool water input Waste heat Pump Water Waste heat Water source (river, lake, ocean) Periodic removal and storage of radioactive wastes and spent fuel assemblies Periodic removal and storage of radioactive liquid wastes
Figure 17-24Page 368 Decommissioning of reactor Fuel assemblies Reactor Enrichment UF6 Fuel fabrication Temporary storage of spent fuel assemblies underwater or in dry casks (conversion of enriched UF6 toUO2 and fabrication of fuel assemblies) Uranium 235 as UF6 Plutonium-239 as PuO2 Conversion of U3 O8 to UF6 Spent fuel reprocessing Low level radiation with long half-life Geologic disposal of moderate and high-level radioactive wastes Open fuel cycle today Prospective “closed” end of fuel cycle
Figure 17-25Page 369 Reactors 1 Operational Yucca Mountain high-level nuclear waste storage site 1 Decommissioned
Figure 17-26Page 370 Trade-Offs Conventional Nuclear Fuel Cycle Advantages Disadvantages Large fuel supply High cost (even with large subsidies) Low environmental impact (without accidents) Low net energy yield High environmental impact (with major accidents) Emits 1/6 as much CO2 as coal Catastrophic accidents can happen (Chernobyl) Moderate land disruption and water pollution (without accidents) No widely acceptable solution for long-term storage of radioactive wastes and decommissioning worn-out plants Moderate land use Low risk of accidents because of multiple safety systems (except in 35 poorly designed and run reactors in former Soviet Union and Eastern Europe) Subject to terrorist attacks Spreads knowledge andtechnology for building nuclear weapons
Figure 17-27Page 371 Trade-Offs Coal vs. Nuclear Coal Nuclear Ample supply Ample supply of uranium Low net energy yield High net energy yield Low air pollution (mostly from fuel reprocessing) Very high air pollution High CO2 emissions Low CO2 emissions (mostly from fuel reprocessing) High land disruption from surface mining Much lower land disruption from surface mining High land use Moderate land use Low cost (with huge subsidies) High cost (with huge subsidies)
Figure 17-28Page 373 Storage Containers Fuel rod Primary canister Ground Level Unloaded from train Personnal elevator Overpack container sealed Air shaft Underground Nuclear waste shaft Buried and capped Lowered down shaft 2,500 ft. (760 m) deep
Figure 17-29Page 374 Nuclear power plants Yucca Mountain Railroads Highways
Animation HIV replication animation. Click to view animation.
Animation HIV replication animation. Click to view animation.