Download
1 / 26
280 likes | 475 Views
the HARMONI integral field spectrograph. A Work-Horse Instrument for the E-ELT. Niranjan Thatte University of Oxford. What do Giants Eat?. Fe-Fi-Fo-Fum, I smell the blood of an Englishman, May he be alive, or may he be dead… I’ll grind his bones to make my bread. HARMONI at the E-ELT.

E N D
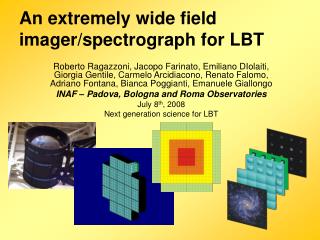
the HARMONIintegral field spectrograph A Work-Horse Instrument for the E-ELT Niranjan Thatte University of Oxford
What do Giants Eat? Fe-Fi-Fo-Fum, I smell the blood of an Englishman, May he be alive, or may he be dead… I’ll grind his bones to make my bread
HARMONI Consortium Matthias Tecza1, Fraser Clarke1, Roger L. Davies1, Alban Remillieux2, Roland Bacon2, David Lunney3, Santiago Arribas4, Evencio Mediavilla5, Fernando Gago6, Naidu Bezawada3, Pierre Ferruit2, Ana Fragoso5, David Freeman7, Javier Fuentes5, Thierry Fusco18, Angus Gallie3, Adolfo Garcia10, Timothy Goodsall8, Felix Gracia5,Aurelien Jarno2, Johan Kosmalski2, James Lynn1, Stewart McLay3, David Montgomery3, Arlette Pecontal2, Hermine Schnetler3, Harry Smith1, Dario Sosa5, Giuseppina Battaglia6, Neil Bowles1, Luis Colina4, Eric Emsellem6, Ana Garcia-Perez13, Szymon Gladysz6, Isobel Hook1, Patrick Irwin1, Matt Jarvis13, Robert Kennicutt19, Andrew Levan17, Andy Longmore3, John Magorrian1, Mark McCaughrean16, Livia Origlia11, Rafael Rebolo5, Dimitra Rigopoulou1, Sean Ryan13, Mark Swinbank15, Nial Tanvir14, Eline Tolstoy12, Aprajita Verma1
A Single Field Wide Band Spectrograph • A near infrared integral field spectrograph covering the 0.8 − 2.4 μm wavelength range, with simultaneous coverage of at least one band at a time. R~4000 to work between the OH lines. • Range of spatial resolutions: • from diffraction limited to seeing • Possible extension to visible wavelengths and higher spectral resolution (both now included!) • High throughput (>35%), low thermal background (optimized for K band operation), low scattered light
Design Drivers • Spatially resolved detailed studies of astrophysical sources – physical, chemical, dynamical & kinematics; also ultra-sensitive observations of point sources. • Easy to operate and calibrate • Feasibility for 1st light instrument => simple, reliable, based on proven concepts, can be built with today’s technology. Large amount of expertise in consortium • Workhorse instrument – wide range of science programs, all AO modes, range of spatial & spectral resolutions
20 mas 10 mas 4 mas 40 mas Best combination of sensitivity and spatial resolution Highest spatial resolution (diffraction limited) For extended sources & optimal FoV For optimal sensitivity (faint targets) 128 × 256 spaxels at all scales 5” × 10” 7 2.5” × 5” f 1.25” × 2.5” 0.5” × 1.0”
Scientific motivation • At the fine scale of E-ELT + HARMONI working in the diffraction limit there is enormous value in being able to reconstruct where, in a complex image, a spectrum arises. • Using AO in the infrared conditions change rapidly so that a simultaneous recording of all positions and wavelengths removes ambiguities. • At high z there are many more morphologically complex, low mass objects. Fine angular resolution and high spectral resolution are needed. • IFU records PSF from observations (if FoV contains a point source e.g. quasar BLR).
Stellar Populations: star formation history, chemical & dynamical evolution. Aim to use abundance patterns in RGB & MS stars to unravel star formation history of each galactic component. This work is currently only feasible in MW & MC. EELT+HARMONI will probe local groups (eg. Centaurus & Leo groups) and at the limit reach the Fornax and Virgo clusters. This takes stellar population studies into a completely unexplored realm. Simulations show that • metallicities (±0.3) & velocities (±20km/s) can be measured 1mag fainter than the tip of the RGB in CenA in 1hr at R=9000. • In M87 20 hrs a sample of ~30 stars Challenge: the main metallicity indicators are in the visible. Thus this work does not take full advantage of the AO. Can infrared diagnostics be identified that will give reliable metallicities for RGB stars? Requires: R= 9000 & 20,000 spectra, 20mas spaxels @ 0.6 - 1.0 & 1.0 - 2.5.
5mas per pixel input 10 mas HARMONI scale 20 mas HARMONI scale 40 mas HARMONI scale 100 mas scale on VLT
High-z Ultra-luminous IR Galaxies H in z=2 ULIRG • Survey 50 Spitzer candidate ULIRGs 1<z<2.5 • Detect & characterise nuclear disks & rings • Measure shocks, winds, interaction with IGM • Measure dynamical masses • Distribution of dust • Modes of star formation • Measure rotation, masses, dust content, stellar pops & FP Requires: diffraction limited R > 4000 spectra, spaxels 5-40mas. @ 0.5 - 2.5.
The Physics of High Redshift Galaxiesz=2-5 • Aim: measure the size, velocity & luminosity distribution of HII regions • HII regions as tracers of SFH, mass & mergers • Reddening free estimate of star formation rate • Measure abundances for individual SF regions • Explore HII kinematics as diagnostic of disk settling. Requires : R > 4,000 – 20,000 spectra @ J+H & H+K simultaneously. 4 - 40mas spaxelsFOV 0.5 x 1.0”; 5 x 10”.
High Contrast Science – Characterising Exo-solar Planets • Aim: follow-up spectroscopy of candidate exo-solar planets seen by VLT • Spectral lines provide measure of surface gravity • Combine with other techniques to get density, temperature and luminosity. • Clues to atmospheric composition – constrain models Requires : R > 4,000 – 20,000 spectra @ I+z+J, H+K simultaneously. 4 mas spaxels,FOV 0.5 x 1.0”; SCAO.
Complimentarity with ALMA ALMA will detect cold gas at similar spatial resolution. Many applications require physical properties of both cold gas (ALMA) and stars/warm gas (E-ELT + HARMONI) to advance astrophysics: • How is cold gas converted to stars to make disks and bulges? • What fraction of star formation occurs dues to mergers compared to in-situ processes? • What mechanisms drive star formation in high-z galaxies? • How do the masses of black holes grow? How do they impact galaxy evolution? • How does the generation of heavy elements evolve? Case study: ALMA will measure CO content of Milky Way-like progenitors at z>2. HARMONI will map distribution, strength & velocities of emission line gas. • SFR + mass of cold gas reservoir star formation timescaleduty cycle • Gas/star & gas/dynamical mass fractions build galaxy components • Determine mode of star formation as f(z), environment and galaxy type. What is the dominant mode of star formation at high-z? through GMCs (as in the MW) or starburst (ULIRGs)?
HARMONI vs. JWST NIRSpec IFU • JWST is ~7 smaller than E-ELT but will operate in a low background environment at L2. • Even where they are most closely matched NIRSpec and HARMONI have different capabilities. For example: • Spectral resolution. Highest R for NIRSpec R=2700 (in practice 2300-2500). For HARMONI R lower than 4000 will lead to contamination by telluric lines. • Different spaxel scales => different angular resolution regimes • Extraction apertures • Characterise the two instruments by balancing low background against increased flux and resolution to determine at what wavelength E-ELT + HARMONI is instrument of choice. • Compare of the required exposure time for several “standard” cases. page 16
HARMONI vs. JWST NIRSpec • At J & H E-ELT + HARMONI even in natural seeing HARMONI is 10 faster. • Using LTAO and for extended sources the advantage rise to 100. • At K-band the advantage is retained with LTAO. With GLAO & natural seeing the two facilities are comparable, HARMONI wins at the blue end of K. • Note that both NIRSpec and HARMONI offer other, less comparable capabilites where they have a greater advantage. page 17
Field of View: shape • High precision sky subtraction is essential nodding-on-IFU • Half integration timecf. offset sky measurements. 2:1 aspect ratio for FoV
Field of View: size & sampling • Variable sky & PSF advantage to avoid mosaicing • Typical single objects at z>1 128 x 20mas for short dimension of IFU • Large objects (QSO hosts) or diffuse emission & stellar pops studies largest possible FoV Linear size of FoV (kpc) Linear size of spaxel (pc)
Different Flavours of AO SCAO GLAO LTAO Or even degraded GLAO (NGS only) !!!
Sensitivity • 20 mas spaxels provide best sensitivity for point sources • 40 mas spaxels best for extended sources
Challenges • Large instrument size and mass makes handling difficult HARMONI Integration Laboratory HARMONI Cryostat HARMONI PI
Challenges • Large instrument size and mass makes handling difficult. • Managing large consortia requires professional approach, implies larger management overhead. • Time is precious – efficient operations, long MTBF, simple user interface, preparation software. • Track every item through design, manufacturing, assembly, integration and testing – take nothing for granted
HARMONI More Information We aim to match every PI with his/her observational program! http://astroweb1.physics.ox.ac.uk/instr/HARMONI/ Please visit our premier site