Download
1 / 16
160 likes | 292 Views
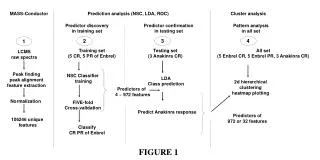
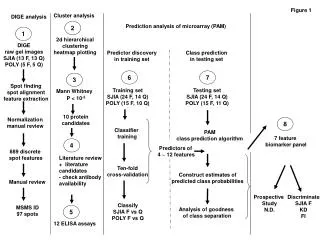
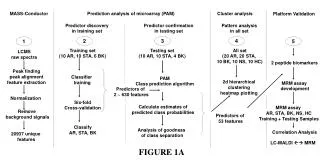
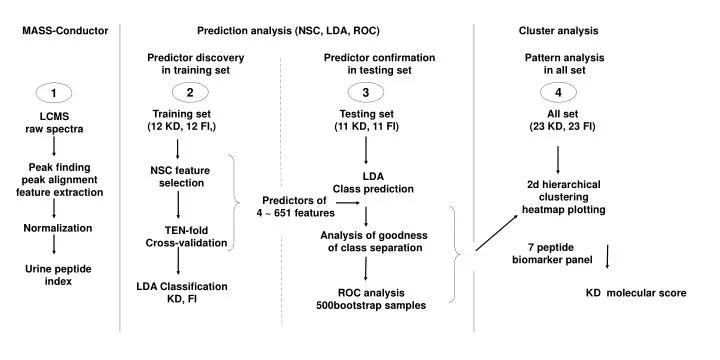
MASS-Conductor. Prediction analysis (NSC, LDA, ROC). Cluster analysis. Predictor discovery in training set. Predictor confirmation in testing set. Pattern analysis in all set. 2. 3. 4. 1. Training set (12 KD, 12 FI,). Testing set (11 KD, 11 FI). All set (23 KD, 23 FI). LCMS

E N D
MASS-Conductor Prediction analysis (NSC, LDA, ROC) Cluster analysis Predictor discovery in training set Predictor confirmation in testing set Pattern analysis in all set 2 3 4 1 Training set (12 KD, 12 FI,) Testing set (11 KD, 11 FI) All set (23 KD, 23 FI) LCMS raw spectra Peak finding peak alignment feature extraction NSC feature selection LDA Class prediction 2d hierarchical clustering heatmap plotting Predictors of 4 ~ 651 features Normalization TEN-fold Cross-validation Analysis of goodness of class separation 7 peptide biomarker panel Urine peptide index LDA Classification KD, FI ROC analysis 500bootstrap samples KD molecular score
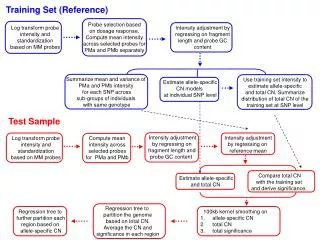
A B Training Testing KD FI KD FI Training set n = 24 Testing set n = 22 Clinical diagnosis Clinical diagnosis KD FI KD FI 12 12 11 11 n = n = LDA LDA Predicted probabilities Predicted as KD Predicted as KD 12 0 9 4 Predicted As FI Predicted as FI 0 12 2 7 Percent Agreement with clinical diagnosis Percent Agreement with clinical diagnosis 100% 100% 82% 64% + - + - 100% 73% Overall P = 7.4X10⁻⁷ Overall P = 0.08 Patient samples
C D KD n=23 FI n=23 Data set n = 46 Clinical diagnosis KD FI MH+ ID n = 23 23 2007.91 COL3A1 2d Cluster 2443.07 COL3A1 Clustered as KD 21 1 2767.33 COL1A1 Clustered as Non-KD 2 22 2017.94 COL1A1 91.3% 95.7% 1142.47 COL1A1 Percent Agreement with clinical diagnosis + - 1368.58 COL17A1 93.5% Overall P =1.5X10⁻⁹ 1126.51 COL9A2
Sensitivity Training Mean(AUC): 98.4% Testing Mean(AUC): 91.6% 1- Specificity
MH+ 1126.51 PP*GPP*GYPGKQ COL9A2 * Loss of NH3
MH+ 1142.47 GPP*GP*PGPPGPPS COL1A1
MH+ 1368.58 LPGPP*GPP*GSFLSN COL17A1
MH+ 2008.91 DGESGRP*GRP*GERGLP*GP*PG COL3A1 ~ Loss of H2O * Loss of NH3
MH+ 2017.94 GRP*GEVGP*PGPPGP*AGEKGSP COL1A1 * Loss NH3
MH+: 2443.06 GPP*GSNGNP*GPPGP*SGSP*GKDGP*PGPAG COL3A1 ~ Loss of H2O * Loss of NH3
MH+: 2768.33 KEGGKGPRGETGPAGRP*GEVGPP*GPP*GPAG COL3A1 ~ Loss of H2O * Loss of NH3
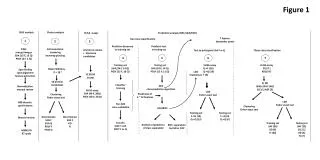
50 Low Risk Group Intermediate Risk Group High Risk Group * 40 KD% of Total patients KD: n = 0 FI: n = 17 KD: n = 4 FI: n = 4 KD: n = 19 FI: n = 2 30 * 20 10 * 0 * 0 2 2.5 4 6 6.9 KD urine Score
1.0 0.8 0.6 Sensitivity KD versus FI 0.4 Training AUC: 100% 0.2 Testing AUC: 79.3% 0.0 0.2 0.6 1.0 0.0 0.4 0.8 1- Specificity