Download

1 / 16
170 likes | 261 Views
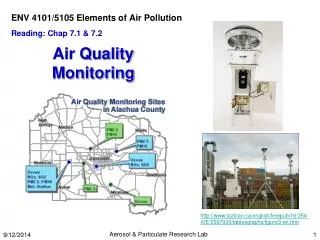
TREND ANALYSES OF AIR QUALITY MONITORING DATA USING MANN-KENDALL TESTS Geneva, 20 March 2002. Timo Salmi Finnish Meteorological Institute Air Quality Research timo.salmi@fmi.fi. Content. Introduction Methods and limitations Excel template Examples. INTRODUCTION.

E N D
TREND ANALYSES OF AIR QUALITY MONITORING DATA USING MANN-KENDALL TESTSGeneva, 20 March 2002 Timo SalmiFinnish Meteorological Institute Air Quality Research timo.salmi@fmi.fi
Content • Introduction • Methods and limitations • Excel template • Examples
INTRODUCTION • Nordic-Baltic EMEP assessment project • Methods selected for trend analysis of annual values: • existence: Mann-Kendall test • magnitude: Sen’s Slope estimator • Excel template for statistical calculations • Template and user manual will be available also for other countries
REFERENCES Gilbert, R.O. 1987. Statistical methods for environmental pollution monitoring. Van Nostrand Reinhold, New York. Alain Siros, 1998. A Brief and Biased Overview of Time- Series Analysis or How to Find that Evasive trend. In WMO report No. 133: WMO/EMEP Workshop on Advanced Statistical Methods and their Application to Air Quality Data
MANN-KENDALL TEST • Ho: The values are randomly ordered in time • H1: There is a monotonic trend in time => for annual air quality values only • Nonparametric: test parameter Z depends only on ranking of values • Z normally distributed when n10 • Template calculates two-tailed tests for significance levels 0.001 (***99.9%) , 0.01 (**99%), 0.5 (*95%) and 0.1 (+90%) • Missing values allowed
SEN’S SLOPE ESTIMATOR • Linear model for trend f(t)=Q t + C • Nonparametric - no assumption about distribution of residuals but variance of residuals should be constant in time • Template calculates Sen’s estimator for Q and it’s 99% and 95% confidence intervals • Valid when N>10 and not many ties • Missing values allowed
SUMMARY • An easy to use Excel template has been created for calculation trend statistics of annual air quality values • Methods used are Mann-Kendall test for trend significance and Sen’s slope estimates • The template will be used in the joint Nordic-Baltic EMEP Assessment project • The template can be made available for other countries working with EMEP Assessment, possibly by the EMEP web-site • The users manual will be published and made available too • Limitations of the methods must be taken into consideration