Download
1 / 36
360 likes | 502 Views
GIS-Based Gridded Forecast Assessment. Gordon Strassberg WFO Miami With Contributions by Jack Settelmaier NWS Southern Region HQ Presented to HPC 9 April 2009. Goals/Motivation. Create more quickly/readily available gridded verification. More useful than current point verification methods.

E N D
GIS-Based Gridded Forecast Assessment Gordon Strassberg WFO Miami With Contributions by Jack Settelmaier NWS Southern Region HQ Presented to HPC 9 April 2009
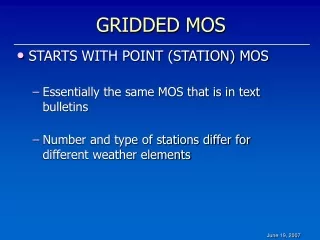
Goals/Motivation • Create more quickly/readily available gridded verification. • More useful than current point verification methods. • Integrate Geographic Information Systems into operations and use associated tools/capabilities. • Provide motivation to identify potential “forecast opportunities” for large deviations from climatology and/or large model errors.
Overview • NWS Southern Region STSD (Jack Settelmaier/Bernard Meisner) investigate 5km NDFD, GMOS, RTMA grids. • 32km NARR Monthly Climatology used to calculate anomalies. • Use 12Z Temp from RTMA as proxy for Min Temp, since Min Temp grids not natively created from RTMA analysis. Also created based on 00Z RTMA. • Automated daily as near real-time as possible to provide feedback on forecasts just issued, rather than waiting on monthly NDFD or Stats on Demand stats.
Overview (Continued) • Images generated for CONUS domain with subset made for NWS Southern Region and posted on Southern Region Intranet site (see examples next slides). • Images show forecast errors for previous 7 days’ forecast ending on current day. • Images also generated to show forecast temperature anomalies.
Examples White areas -5 to +5 degree “acceptable” range for Days 4-7; -3 to +3 degrees Days 1-3 Cool colors Too cool Warm colors Too warm 12Z NDFD-RTMA difference grids
Examples 12Z GMOS-RTMA difference grids
Examples Areas too warm Areas too cool 12Z NDFD-RTMA difference grid for Day 1 Forecast
How Can We Use This Data? Examples From WFO Miami
WFO Miami Work • Subset of data for only state of Florida made available. • Data downloaded automatically each day after processed at Southern Region. • Perhaps more centralized efforts better? • Data can be used for additional calculations locally (currently being implemented). • Model vs. forecast errors can be easily compared.
WFO Miami Work • Using ArcMap Model Builder/additional Python modification. • Perform calculations on provided data. • Currently, creating images for running average 7-day errors for each individual day (ie, weekly Day 1 forecast error over the past 7 days), and average day 1-7 average error). • Generated for GMOS-RTMA and NDFD-RTMA.
WFO Miami Work GMOS-RTMA Day 1 Forecast Valid 3/14 12Z NDFD-RTMA Day 1 Forecast Valid 3/14 12Z WFO Forecast Errors much smaller (white areas “acceptable” errors as previously denoted)!
WFO Miami Work GMOS-RTMA Day 7 Forecast 3/14 12Z NDFD-RTMA Day 7 Forecast 3/14 12Z WFO Forecast Errors much smaller!
Potential Pitfalls • RTMA is NOT perfect! • Errors in interpolation between observations. • Utilizes mesonet observations which can be a significant source of error (QC not always accurate). • Coastal interface particularly challenging in S. Florida-limited if any offshore obs for use. • Results in sometimes significant discrepancies along land-sea interface (green arrows previous graphics).
Potential Pitfalls • We know the RTMA is imperfect… • But that doesn’t mean we can’t use it as a rough approximation to supplement/enhance local or regional verification. • More useful for WFO forecasters to have very good regionalized verification in near real-time as opposed to point verification much later. • Makes more aware of pattern recognition, model performance/biases, etc.
WFO Miami Case Study January 22, 2009 Significant Freeze Event
January 22, 2009 Day 7 NDFD-RTMA valid 12Z 1/22/09 Day 5 NDFD-RTMA valid 12Z 1/22/09 Large warm forecast errors! Extended forecasts often trend towards model guidance. Freeze events change in extended; we exercise caution locally beyond Day 4.
January 22, 2009 Day 4 NDFD-RTMA valid 12Z 1/22/09 Day 2 NDFD-RTMA valid 12Z 1/22/09 Forecasts get refined and more accurate Days 4 and by even more Day 2 As potential freeze event approaches, forecast fine-tuned as confidence of event occurrence increases. Freeze outlooks issued as early as Day 5.
January 22, 2009 Day 1 forecasts generally accurate or exhibit a slight cool bias. Hard Freeze (below 28F for 3+ hrs) Lake Okeechobee region. Palmdale 22F in Glades County. Archbold Bio Station mid teens in Highlands County (Tampa CWA).
How Can We Use This Data? Examples of Model Error/Biases
Examples-Model Error Model consistently too warm in regions of negative departure from climo.
Examples-Model Error Why the lack of warm bias across deep South within this colder than normal region? Model consistently too warm in negative departure from climo regions.
Examples-Model Error Model difficulty handling complex scenario across Plains/Ern Rockies.
How Can We Use This Data? Examples of Forecast Errors—Other Locations
Examples-Forecast Error Forecast Errors improve with time along I-70 corridor.
Examples-Forecast Error Forecasts too cool SE states approaching warm event Some improvement by the Day 1 forecast.
Examples-Forecast Error Forecast errors increase with time central Plains.
Future Work Potential Direction for the Entire NWS (local WFO, regional and national centers)
Future Work • Automated data archive can allow monthly or seasonal calculations. • Potentially track by forecaster for more individualized results. • NWS Southern Region exploring potential similar POP verification. • Research patterns leading to large model errors to identify “forecast opportunities.” • Individual WFO, regional or national collaboration. HPC could be beneficial with pattern recognition/analysis.
Direction • Migration to ArcGIS Server would be ideal. • Users (WFO, HPC, etc.) could access specific data fields, zoom, query, etc. • Centralized data crunching can feed any office efficiently. • May be more efficient than each WFO doing local calcs (disk space, CPU issues)-but could allow more local customization and manipulation.
Direction • Perhaps a more efficient method may be to save certain fields only (which highlight magnitude of an event) into database format to allow querying for historical/research purposes? • Can be used to generate average observed errors: • Perhaps a more efficient method may be to save certain fields only (which highlight magnitude of an event) into database format to allow querying for historical/research purposes? Perhaps a more efficient method may be to save certain fields only (which highlight magnitude of an event) into database format to allow querying for historical/research purposes? Can be used to generate average observed errors: Cumulative Error example
Observed Error http://www.srh.noaa.gov/srh/ssd/assess/20090320_12_T_NDFDErrorsTrendSRDay7-1.png
Acknowledgements Credit goes to the NWS Southern Region Science and Technology Services Division for initiating this project/gathering/providing data. Special thanks to Jack Settelmaier and Bernard Meisner, for providing background information for this presentation. Doug Gaer (ITO) and Pablo Santos (SOO) for their assistance at WFO Miami.
Questions/Comments?Ideas for HPC/WFO collaborative studies? gordon.strassberg@noaa.gov jack.settelmaier@noaa.gov Thanks for your attention!