Download
1 / 63
640 likes | 802 Views
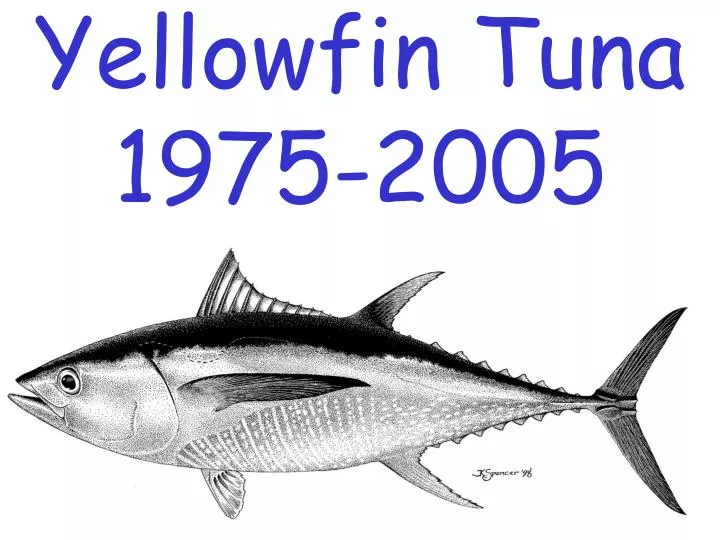
Yellowfin Tuna 1975-2005. Major Changes. Catch, effort, and length-frequency data for the surface fisheries have been updated to include new data for 2005 and revised data for 1975-2004.

E N D
Major Changes • Catch, effort, and length-frequency data for the surface fisheries have been updated to include new data for 2005 and revised data for 1975-2004. • Catch data for the Japanese longline fisheries have been updated for 2000-2003 and to include new data for 2004. • Catch data for the longline fisheries of Chinese Taipei have been updated for 2002 and new data added for 2003. • Catch data fore the longline fisheries of Korea have been updated to include new data for 2003 • Catch data for the longline fisheries of the Peoples Republic of China have been updated to include new data for 2003 and 2004. • Longline catch-at-length data for 2002-2003 have been updated and new data for 2004 added. • Longline catch per unit effort data have been standardized using a delta-lognormal model, updated to include 2004 data. • Growth model has been changed to fix length-at-age at the prior distribution of a Richards growth curve based on otolith data
Sensitivity Analyses • Stock recruitment relationship • Asymptotic length
Data • Fishery definitions • Catch • Effort • Length frequency
Catch DIS south DIS central DIS coastal DIS north DOL south LL south LL north BB DOL coastal DOL north NA north NA south FO north FO south FO central FO coastal
Effort DIS coastal DIS north DIS central DIS south LL south DOL south LL north BB NA north NA south DOL north DOL coastal FO coastal FO central FO south FO north
CPUE DIS south DIS coastal DIS north DIS central LL south LL north DOL south BB NA north NA south DOL north DOL coastal FO coastal FO south FO north FO central
Fixed Parameters • Natural Mortality • Fecundity at age • Sex ratio at age • Selectivity curves for the discard fisheries • The steepness of the stock recruitment relationship = 1 (no relationship)
0.5 0.4 0.3 Quarterly M -- M Trimestral 0.2 0.1 0.0 4 8 12 16 20 24 28 Age in quarters -- Edad en trimestres Natural Mortality
0.5 0.4 0.3 Percent female 0.2 0.1 0.0 0 5 10 15 20 25 Age in quarters Sex Ratio
6 5 4 Relative fecundity x maturity 3 2 1 0 0 5 10 15 20 25 Age in quarters Relative Fecundity
Estimated parameters • Recruitment • Temporal anomalies, (no Seasonal component) • Catchability • Temporal anomalies • Selectivity • Initial population size and age-structure • Mean length at age • Variation of length at age
Results • Fit to the length frequency • Growth • Fishing mortality • Selectivity • Recruitment • Biomass • Catchability
Fit to the length-frequency LL south LL north BB DOL south NA north NA south DOL north DOL coastal FO south FO central FO coastal FO north
NA north NA south Selectivity DIS central DIS south DIS coastal DIS north LL north BB DOL south LL south DOL north DOL coastal FO north FO south FO coastal FO central
Catchability LL north BB LL south DOL north DOL south DOL coastal NA north FO north NA south FO central FO south FO coastal
Recent length-frequency data (FO) 1 4 2 3 FO south FO central FO coastal FO north
Recent length-frequency data (Unassociated) NA north NA south
Recent length-frequency data (Dolphin associated) DOL north DOL south DOL coastal
Recent length-frequency data (longline) LL north LL south
Average weight Surface Longline LL south LL north NA south DOL north DOL coastal BB DOL south FO south FO central FO coastal FO north NA north
Reference points & projections • Assumptions • For MSY calculations • Average of 2002-2003 for fishing mortality • For forward projections • Average of 2002-2003 for catchability • 2004 effort
Sensitivity: h = 0.75 • When the spawning population is 20% of its unexploited level the recruitment is 75% of its unexploited level • Biomass • Recruitment • SBR • Yield Curve • AMSY