Download
1 / 39
390 likes | 540 Views
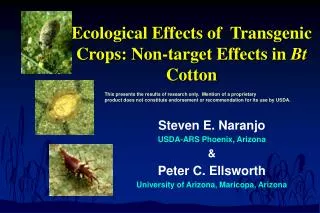
Bt Crops. Paul Jepson Integrated Plant Protection Center Oregon State University. Examples of traits and their associated genetic elements and sources. Source: AgBiosafety, UNL (08/2001) www.agbiosafety.unl.edu. Regulatory approvals for Bt transgenic crops.

E N D
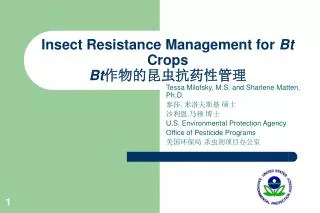
Bt Crops Paul Jepson Integrated Plant Protection Center Oregon State University
Examples of traits and their associated genetic elements and sources Source: AgBiosafety, UNL (08/2001) www.agbiosafety.unl.edu
Regulatory approvals for Bt transgenic crops Source: AgBiosafety, UNL (08/2001) www.agbiosafety.unl.edu
Areas of concern in the public domain • Environment • Health • Consumer rights and labeling • Ethics • Concerns targeted to the poor and excluded • Sustainable vs “industrial” agriculture Source: Conway, G. (2000) Rockerfeller Foundation
GMO Environmental Risks and Benefits • Risks of invasiveness • Non-target organism impacts • New viral diseases • Reduced pesticide environmental impact • Reduced rate of land conversion • Soil conservation • Phytoremediation Source: Wolfenbarger & Phifer (2000) Science
Risk of invasivenessSteps that may lead to environmental harm Source: Wolfenbarger & Phifer (2000) Science Example of this pathway for Canola
Investigations of risk of invasiveness ? ? ? ? Source: Wolfenbarger & Phifer (2000), Science
O. sativa-weedy rice hybrids containing herbicide resistant traits Chen, LJ et al 2004, Annals of Botany 93, 67-73
Design B Design A Design C Gene flow frequencies from rice to O. rufipogon varied between 3% - 8%, measured by SSR markers O. sativa O. rufipogon Bao-Rong Lu
Non-target data considered in latest EPA risk assessment for Bt crops* • Larval and adult honeybee • Green lacewing* • Ladybird beetles • Parasitic Hymenoptera • Monarch butterfly* • Avian oral toxicity • Static renewal acute toxicity, Daphnia • Corn as food for farmed fish • Collembola • Earthworms OVERALL Very limited evidence for toxic effects* *Standard studies based on EPA Subdivision M and/or OPPTS 885 Guidelines
Example of an EPA regulatory action • October 15th, 2001 ‘Biopesticides Registration Action Document’, USEPA OPP • B.t. Corn and B.t. Cotton • Extended registrations with additional terms and conditions • Non-target insects: field census data required • Monarch long-term exposure to Cry 1 Ab • Chronic avian study
Monarch butterflyRisk assessment over a large geographic scale
Monarch butterfly research • Published in PNAS, 2001 • Research addressed • Sensitivity to B.t. protein and pollen in the lab • Pollen burden on milkweed in and near corn • Exposure assessment • Effects in the field • Overall risk assessment • Corn used more extensively as a habitat by Monarch butterfly than expected • Risks to butterflies of most B.t. corn events low • The most toxic event removed from the market-place
Impacts of conventional pesticides on field boundary Lepidoptera • Spray drifts onto field boundary vegetation • Low pyrethroid doses have an anti-feedant effect • Pupae are reduced in size • Adults are smaller • (Cilgi and Jepson, 1995)
Butterfly mortality can occur as a result of pesticide drift into field boundaries e.g. mortality of Pieridae in boundaries exposed to pyrethroid drift Longley et al, ’97, Env. Tox. & Chem., 16, 165-172
Field census data:Natural Enemy Abundance in B.t. and Conventional Cotton Fields Head, G., Freeman, B., Moar, W., Ruberson J., And Turnipseed, S.
Spiders in Cotton Fields 60 50 40 Bt cotton Abundance / sample 30 20 Source, Head et al Conventional 10 0 20-Jun 27-Jun 04-Jul 11-Jul 18-Jul 25-Jul 02-Aug Date
Ladybird Beetles in Cotton Fields 140 120 100 80 Conventional Abundance / sample 60 40 Source, Head et al Bt cotton 20 0 20-Jun 27-Jun 04-Jul 11-Jul 18-Jul 25-Jul 02-Aug Date
Farm-scale effects of using genetically engineered crops Source, Fernandez-Cornejo,J., McBride, W.D. (2000) USDA ERS
Evidence for scale-dependency in ecological impacts Some beneficial invertebrates are locally extirpated by repeated application of conventional pesticides to whole fields e.g. Carabid ground beetles • These effects are not detected in short term, within-field experimental regimes • They have been seen repeatedly in large-scale multi-field experiments ., 30, 696-705
Many non-target species disperse within and between fields and repopulate areas following reductions after pesticide use ~ Short Range ~ Middle Range ~ Long Range lacewings ballooning spiders ground spiders rove beetles parasitoid wasps hoverflies ground beetles predacious bugs ladybird beetles
Transgenic vs. conventional delivery Indirect effects may be more important than direct effects • Specialist natural enemies may be reduced because of profound impacts on target herbivores in all B.t. fields Exposure pathways very different • Most non-target taxa are not exposed to plant-incorporated protectants at all: a feeding pathway is required for toxicity • Certain taxa exposed to PIP’s via diet, for the whole season, and some of these may be susceptible • Exposure is synchronizedbetween fields
Spider population modeling Landscape average where 50% of fields sprayed in week 24, or in an increasing range of dates in weeks 20-23, & 25-29 (From Halley et al., 1996, J. Appl. Ecol.) With short-persistence pesticides, small variation in the range of exposure timings can generate effective refugia within fields that have been sprayed
Rapid response of spiders to small variation in spray timing is a function of high dispersal and reproductive rates e.g. (Thomas et al.(2003) J. Appl. Ecol.)
Selection of organisms for monitoring • Exposure: detritivores, herbivores, predators and parasites • Indirect effects: trophic position, diet specialization
Conclusions (Part 1) • Environmental risk assessment still under development, particularly for risk of gene flow, and for large scale effects • Ability to determine higher risk situations improving • PIP’s significantly different to pesticides • Benefits of pesticide reductions need to be examined • Potential use within sustainable development programs not certain: many other factors are important • Acceptance of work demonstrating negative impacts has been poor (J. Ag. & Env. Ethics. (2001) 14: 3028)
FIFRA Scientific Advisory Panel Concerns about data submitted by industry • Many ‘tier 1’ tests submitted by industry are flawed or incomplete • Presence of toxin not demonstrated in artificial diets for test species • Control mortality so high that it masks possible effects • Some tests (e.g. treated insect eggs), do not expose certain insect predators to the toxin • No statistical analysis of some tests • Field evaluation no substitute for tier 1 risk assessment testing • Data do not support EPA statement that Bt corn (MON 863) results in less impact on non-target invertebrates than conventional pest management practices • Several field studies had no statistical analysis to support them • Plot sizes were trivial, reducing likelihood of detecting treatment effects (even highly toxic pesticide effects were nor detectable in some investigations) • Statistical power halved in GM crop plots as a result of flawed experimental design
Non-target invertebrates: Recommendations: Specific(Made in consultation with USDA APHIS, 2003) • Develop database of approved protocols • Exposure and its validation • Species selection and source • Test protocols • Statistical approaches • GLP QA standards including criteria for non-acceptability • Adopt a policy of exploiting the range of internationally available test methods • Participate in international working groups (SETAC, IOBC, ISO, OECD) • Develop decision process for test selection • Relevant, but narrow range of options • Representativeness of taxon • Taxa that fall within susceptibility range • Develop a database of results • Develop clear criteria for test evaluation • E.g. for field tests, standards for design, layout, sampling method, taxonomic resolution, statistics etc • Adhere to the principles of tier-wise testing • Triggers between stages • Understand role and limitations of laboratory tests • Exploit semi-field, field, and monitoring studies • Initiate development of geographically explicit risk assessment • Zones of risk
Use of Environmental Impact Quotients to compare pesticide environmental risks in conventional and transgenic cotton
Mass application rates and spray frequencies in B.t. and traditional cotton
Average Pesticide Use/Grower (Kg/ha) Bt-Cotton Traditional Cotton Most commodities world-wide are treated with <1 Kg/Ha/year
Average Number of Sprays/Grower Traditional Cotton Bt-Cotton
A method to measure pesticide environmental impact • Rating system used to develop environmental impact quotient (EIQ, Kovach et al., 1992) (1, least toxic, 5, most harmful) • Mode of action: non-systemic (1), all herbicides (1), systemic (3) • Acute dermal LD50 for rabbits/rats (mg/kg): >2000 (1), 200-2000 (3), <1-200 (5) • Long-term health effects: little or none (1), possible (3), definite (5) • Plant surface residue half-life: 1-2 weeks (1), 2-4 weeks (3), >4 weeks (5) • Soil residue half life: <30 d (1), 30-100 d (3), >100 d (5) • Toxicity to fish (96h LC50): >10 ppm (1), 1-10 ppm (3), <1 ppm (5) • Toxicity to birds (8-day LC50): >1000ppm (1), 100-1000 ppm (3), 1-100 ppm (5) • Toxicity to bees: rel. non-toxic (1), mod. toxic (3), highly toxic (5) • Toxicity to beneficials: low impact (1), moderate impact (3) severe impact (5) • Groundwater and run-off potential: small (1), medium (3), large (5)
Calculating the EIQ • EIQ = [C[(DT*5)+(DT*P)]+[C*((S+P)/2*SY)+(L)]+[(F*R)+(D*((S+P)/2)*3)+(Z*P*3)+(B*P*5)]}/3 • DT= dermal toxicity, C= chronic toxicity, SY=systemicity, F= fish toxicity, L=leachingpotential, R= surface loss potential, D=bird toxicity, S= soil half life, Z=bee toxicity, B=beneficial arthropod toxicity, P=plant surface half life • EIQ (field use rating)= EIQ *%AI*rate
Environmental impact quotient, based on Kovach et al. (1992)
Field Use EIQ Traditional Cotton Bt-Cotton
The sensitivity of different farming systems to disturbance highly variable Surface reflectance: Global Vegetation Monitoring Unit, JRC, Ispra Farming systems, FAO/World Bank
Conclusions/questions • At what stage will we know enough to possibly reduce the requirement for extensive testing of Bt crops? • Are we exhibiting dual standards by requiring greater scrutiny of Bt crops, compared with conventional pesticides? • Is equivalent scrutiny required at each new location for GM crop adoption?