Download
1 / 38
380 likes | 560 Views
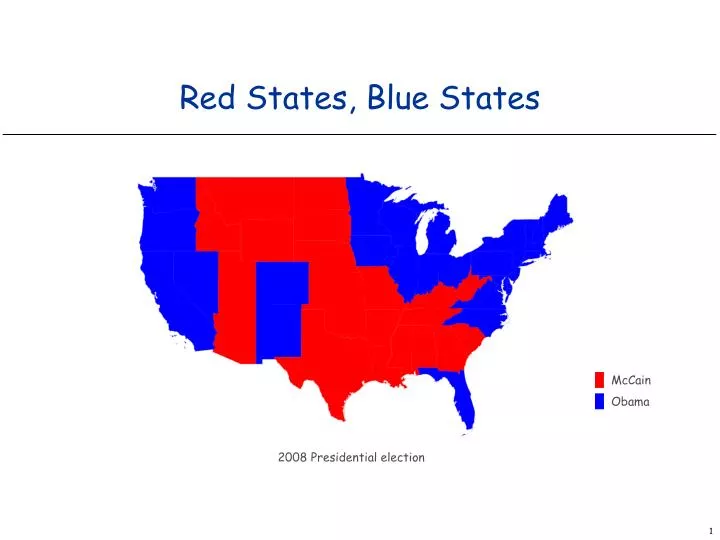
Red States, Blue States. McCain. Obama. 2008 Presidential election. Modular Programming. Modular programming. Model problem by decomposing into components. Polygon. Geometric primitive. Region. Name, postal abbreviation, polygonal boundary.

E N D
Red States, Blue States McCain Obama 2008 Presidential election
Modular Programming Modular programming. Model problem by decomposing into components. Polygon. Geometric primitive. Region. Name, postal abbreviation, polygonal boundary. Vote tally. Number of votes for each candidate. Election map. Regions and corresponding vote tallies for a given election. ElectionMap … … VoteTally VoteTally Region Region String String Polygon
Boundary Data: States within the Continental US USA data file. State names and boundary points. Data source: US census bureau, www.census.gov/geo/www/tiger/. % more USA.txt -124.731216 24.544102 -66.980385 49.384365 104 Alabama USA 498 -88.200027 34.995548 -88.202919 35.007942 … New Jersey USA 368 -74.695305 41.357330 -74.461754 41.250000 -74.366302 41.202801 … -74.721313 41.347294 … (-66.98, 49.38) number of regions bounding box 368 points(latitude, longitude) (-124.73, 24.54)
Boundary Data: Counties within a State State data files. County names and boundary points. Data source: US census bureau, www.census.gov/tiger/boundary. (-73.89, 41.35) % more NJ.txt -75.560143 38.928589 -73.894402 41.35733 21 Atlantic NJ 127 -74.877563 39.608414 -74.736694 39.729721 … Mercer NJ 88 -74.748825 40.424248 -74.722702 40.375301 -74.674507 40.384399 … -74.808403 40.415401 … number of subregions bounding box 88 points(latitude, longitude) (-75.56, 38.92)
Polygon Data Type Polygon. Closed, planar path with straight line segments. Simple polygon. No crossing lines. polygon(8 points) simple polygon(10 points) simple polygon(368 points)
Polygon Data Type: Java Implementation public class Polygon { private int N; // number of boundary points private double[] x, y; // the points (x[i], y[i]) // read from input stream public Polygon(Scanner in) { N = in.nextInt(); x = new double[N]; y = new double[N]; for (int i = 0; i < N; i++) { x[i] = in.nextdDouble(); y[i] = in.nextDouble(); } } public void fill() {StdDraw.filledPolygon(x, y); } public double perimeter() { … } public boolean contains(double x0, double y0) { … } public StringtoString() { … } }
Polygon: Pieces and Holes Pieces. A state can be comprised of several disjoint polygons. Holes. A county can be entirely inside another county. Charlottesville Northampton
Region Data Type Region. Represents a state or county. Mercer, NJ88 point polygon New Jersey, USA368 point polygon
Region Data Type: Java Implementation public class Region { private String name; // name of region private String usps; // postal abbreviation private Polygon poly; // polygonal boundary public Region(String name, String usps, Polygon poly) { this.name = name; this.usps = usps; this.poly = poly; } public void draw() { poly.fill(); } public boolean contains(double x0, double y0) { return poly.contains(x0, y0); } public String toString() { … } }
Election Returns: By State Election returns. Number of votes for Bush, Kerry, Nader by region. Data source: David Leip, www.uselectionatlas.org. % more USA2004.txt Alabama,1176394,693933,13122, Alaska,190889,111025,10684, Arizona,1104294,893524,14767, Arkansas,572898,469953,12094, California,5509826,6745485,164546, Colorado,1101255,1001732,27343, Connecticut,693826,857488,27455, Delaware,171660,200152,3378, District of Columbia,21256,202970,3360, Florida,3964522,3583544,61744, Georgia,1914254,1366149,21472, Hawaii,194191,231708,3114, Idaho,409235,181098,8114, Kansas,736456,434993,16307, Kentucky,1069439,712733,13688, …Virginia,1716959,1454742,26666, Washington,1304894,1510201,43989, West Virginia,423778,326541,5568, Wisconsin,1478120,1489504,29383, Wyoming,167629,70776,5023, 1,914,254 Bush 1,366,149 Kerry 21,472 Nader
Election Returns: By County Election returns. Number of votes for Bush, Kerry, Nader by region. Data source: David Leip, www.uselectionatlas.org. % more NJ2004.txt Atlantic,49487,55746,864, Bergen,189833,207666,2745, Burlington,95936,110411,1609, Camden,81427,137765,1741, Cape May,28832,21475,455, Cumberland,24362,27875,948, Essex,83374,203681,2293, Gloucester,60033,66835,1096, Hudson,60646,127447,1353, Hunterdon,39888,26050,742, Mercer,56604,91580,1326, Middlesex,126492,166628,2685, Monmouth,163650,133773,2516, Morris,135241,98066,1847, Ocean,154204,99839,2263, Passaic,75200,94962,1149, Salem,15721,13749,311, Somerset,72508,66476,1295, Sussex,44506,23990,900, Union,82517,119372,1498, Warren,29542,18044,622, 56,604 Bush 91,580 Kerry 1,326 Nader
Vote Tally Data Type VoteTally. Represents the election returns for one region. Mercer, NJ New Jersey, USA election returns 56,604 Bush 91,580 Kerry 1,326 Nader 1,670,003 Bush 1,911,430 Kerry 30,258 Nader
Vote Tally Data Type: Java Implementation public class VoteTally { private int rep,dem,ind; public VoteTally(String name, String usps, int year) { In in = new In(usps + year + ".txt"); String input = in.readAll(); int i0 = input.indexOf(name); int i1 = input.indexOf(",", i0+1); int i2 = input.indexOf(",", i1+1); int i3 = input.indexOf(",", i2+1); int i4 = input.indexOf(",", i3+1); rep = Integer.parseInt(input.substring(i1+1, i2)); dem = Integer.parseInt(input.substring(i2+1, i3)); ind = Integer.parseInt(input.substring(i3+1, i4)); } public Color getColor() { if (rep > dem) return StdDraw.RED; if (dem > rep) return StdDraw.BLUE; return StdDraw.BLACK; } } % more NJ2004.txt … Mercer,56604,91580,1326, … i1 i0 i2 i3 i4
Screen Scraping the Election Returns Screen scrape. Data available on Web; download html and parse. http://uselectionatlas.org/RESULTS/datagraph.php?year=2004&fips=34 …
Election Scraper (sketch) int year = 2004; // election year String usps = "NJ"; // United States postal code for New Jersey int fips = 34; // FIPS code for New Jersey String url = "http://uselectionatlas.org/RESULTS/datagraph.php"; In in = new In(url + "?year=" + year + "&fips="fips); Out file = new Out(usps + year + ".txt"); String input = in.readAll(); while (true) { // screen scrape county name int p = input.indexOf("width:100px", p); if (p == -1) break; int from = input.indexOf("<b>", p); int to = input.indexOf("</b>", from); String county = input.substring(from + 3, to); // screen scrape vote totals for each candidate // save results to file file.println(county + "," + bush + "," + kerry + "," + nader + ","); } extract text between <b>and </b> tags, that occursafter width:100px
Election Map Data Type ElectionMap. Represents the election map for a given election. public static void main(String[] args) { String name = args[0]; int year = Integer.parseInt(args[1]); ElectionMap election = new ElectionMap(name, year); election.show(); } % java ElectionMap NJ 2004 % java ElectionMap USA 1968
Election Map Data Type: Java Implementation public class ElectionMap { private int N; private Region[] regions; private VoteTally[] votes; public ElectionMap(String name, int year) { In in = new In(name + ".txt"); // read in bounding box and rescale coordinates N = in.readInt(); regions = new Region[N]; votes = new VoteTally[N]; for (int i = 0; i < N; i++) { String name = in.readLine(); String usps = in.readLine(); Polygon poly = new Polygon(in); regions[i] = new Region(name, usps, poly); votes[i] = new VoteTally(name, usps, year); } } public void show() { for (int i = 0; i < N; i++) { StdDraw.setPenColor(votes[i].getColor()); regions[i].draw(); } } }
Modular Programming Relationships among data types. ElectionMap … … VoteTally Region Region int VoteTally String String Polygon int int int … double double int
Visual Display of Quantitative Information Red states, blue states. Creates a misleading and polarizing picture. Edward Tufte. Create charts with high data density that tell the truth.
Purple America Idea. [Robert J. Vanderbei]Assign color based on number of votes. • a1 = Bush votes. • a2 = Nader votes. • a3 = Kerry votes. http://www.princeton.edu/~rvdb/JAVA/election2004 100% Bush 55% Kerry, 45% Bush 100% Kerry 100% Nader public Color getColor() { int tot = dem + rep + ind; return new Color((float) rep/tot, (float) ind/tot, (float) dem/tot); } VoteTally.java
Purple New Jersey % java ElectionMap NJ 2004
Purple America % java ElectionMap USA 2004
Purple America % java ElectionMap USA-county 2004
Data Visualization: Design Issues Remark. Humans perceive red more strongly than blue. Remark. Amount of color should be proportional to number of votes,not geographic boundary. Remark. Project latitude + longitude coordinates to 2d plane. Mercator projection Albers projection
3D Visualization 3D visualization. Volume proportional to votes; azimuthal projection. Robert J. Vanderbei www.princeton.edu/~rvdb/JAVA/election2004
Cartograms Cartogram. Area of state proportional to number of electoral votes. Michael Gastner, Cosma Shalizi, and Mark Newman www-personal.umich.edu/~mejn/election
Eugene Pyatigorsky (based on New York Times visualization) www.ocf.berkeley.edu/~gene/media/docs/Election.pdf
Summary Modular programming. • Break a large program into smaller independent modules. • Ex: Polygon, Region, VoteTally, ElectionMap, In,Out. Ex 1. Build large software project. • Software architect specifies API. • Each programmer implements one module. • Debug and test each piece independently. [unit testing] Ex 2. Build reusable libraries. • Language designer extends language with ADTs. • Programmers share extensive libraries. • Ex: In, Out, Draw, Polygon, …
Interactive Map Goal. Click a county to retrieve its information. public void showRegion(double x, double y) { for (int i = 0; i < numberOfRegions; i++) if (regions[i].contains(x, y)) StdOut.println(regions[i] + "\n" + votes[i] + "\n"); } while (true) { double x = StdDraw.mouseX(); double y = StdDraw.mouseY(); if (StdDraw.mousePressed()) election.showRegion(x, y); StdDraw.show(100); }
Polygon Diversion Q. How to determine whether a point is inside a simple polygon? no two segments cross
Polygon Diversion Q. How to determine whether a point is inside a simple polygon? A. Go in straight line. Count number of times you jump over fence. no two segments cross
OOP Advantages OOP enables: • Data abstraction: manage complexity of large programs. • Modular programming: divide large program into smaller independent pieces.Encapsulation: hide information to make programs robust. • Inheritance: reuse code. Religious wars ongoing.