Download
1 / 47
470 likes | 615 Views
Climate Change Simulations of the 20 th and 21 st Century: Present and Future. Warren M. Washington National Center for Atmospheric Research April 2006. Overview. Is our climate changing? What is in climate models? How do we run the models on supercomputers?

E N D
Climate Change Simulations of the 20th and 21st Century: Present and Future Warren M. Washington National Center for Atmospheric Research April 2006
Overview • Is our climate changing? • What is in climate models? • How do we run the models on supercomputers? • Verification of climate models • Model projections of past and future climates • Mitigation versus adaptation • Future model developments on the path to a Earth System Model (ESM)
2005 Warmest or Tied forRecord Year From GISS/NASA
What is the status of state-of-the-art climate models and their transition to earth system models?
Model Resolutions R15 T42 T170 T85
(300 km) (150 km) (75) km (37 km)
CCSM method Parallel Climate Model Method (PCM)
Global Atmosphere Global Atmosphere
Global and Regional Climate Aspects Using a Climate Model • El Niño/La Niña • Monsoons • North Atlantic Oscillation • Arctic Oscillation
Sea-ice Concentration: Climatology (1979-1999)… Mixture of Improved Physics and Resolution
Title slide Mt Pinatubo eruption in the Philippines, June 15, 1991. Gases and solids injected 20 km into the stratosphere. From Church, White, & Arblaster
Source: World Resources 2000-2001 Time Magazine – 9 April 2001
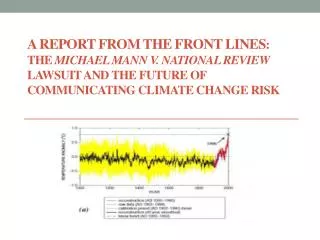
Natural Variations Do Not Explain Observed Climatic Change • Climate models with natural forcing (including volcanic and solar) do not reproduce warming • When increase in greenhouse gases is included, models do reproduce warming • Addition of increase in aerosols (cooling) improves agreement
Climate Change Scenarios: At any point in time, we are committed to additional warming and sea level rise from the radiative forcing already in the system. Warming stabilizes after several decades, but sea level from thermal expansion continues to rise for centuries. Each emission scenario has a warming impact. (Meehl et al., 2005: How much more warming and sea level rise? Science, 307, 1769-1772)
Heat Waves Impacts on human health and mortality, economic impacts, ecosystem and wildlife impacts (Meehl and Tebaldi, 2004: More intense, more frequent and longer lasting heat waves in the 21st century, Science, 305, 994-997)
Observed Climate models can be used to provide information on changes in extreme events such as heat waves Heat wave severity defined as the mean annual 3-day warmest nighttime minima event Model compares favorably with present-day heat wave severity In a future warmer climate, heat waves become more severe in southern and western North America, and in the western European and Mediterranean region Model Future From Meehl and Tebaldi 2005
Controversy (mostly) Settled in 2005! With more greenhouse gases climate models project • Tropospheric temperature increase • Stratospheric temperature decrease • Surface temperature increase • Tropical troposphere warms more than surface What do observations show? • Since 1960 surface and troposphere warm about same rate • Strong decreases in stratospheric temperature and increases in tropopause height since 1979 From T. Karl of NOAA
Figures based on Tebaldi et al. 2006: Climatic Change, Going to the extremes; An intercomparison of model-simulated historical and future changes in extreme events, in press Five indices describe temperature-related extremes: • Total number of frost days (days with absolute minimum temperature below 0 degrees Celsius) frost days • Intra-annual extreme temperature range (difference between the highest temperature observation of the year and the lowest) xtemp range • Growing season length (length of the period between the first stretch of five consecutive days with mean temperature above 5 degrees Celsius and the last such stretch of the year) growing season • Heat wave duration index (maximum period of at least 5 consecutive days with maximum temperature higher by at least 5 degrees Celsius with respect to the climatological norm for the same calendar day) heat waves • Warm nights (percent of times when minimum temperature is above the 90th percentile of the climatological distribution for that calendar day) warm nights
Past and Future Rise in Sea Level 20,000 years ago 2200? ( + 5 meters)
Oouchi, K., J. Yoshimura, H. Yoshimura, R. Mizuta, S. Kusunoki and A. Noda, 2005: Tropical cyclone climatology in a global-warming climate as simulated in a 20km-mesh global atmospheric model: Frequency and wind intensity analyses. J. Meteor. Soc. Japan, Accepted. • Changes in hurricane and tropical cyclone climatology • Most models have 100 km grids this study has 20 km. • Eye and eye walls in the simulations • Winds speeds increase by 8.8 m/sec, more intense storms • Less frequent formation of storms by 30% • Significant increase in intense storms
Fewer Cyclones and Hurricanes But More Intense Oouchi et al. 2005
Ongoing and Future Climate Change Developments • Higher resolution, especially important near mountains, river flow, and coast lines • Full hydrological coupling including ice sheets…important for sea level changes • Continued improvement in clouds and aerosol effects • Better vegetation and land surface treatments with ecological interactions • Carbon and other biogeochemical cycles
Changes That Affect Renewal Resources • Warmer, more moist, heavier rainfall events • Jet stream move further poleward and weaker • Storm systems moving slower but more intense rainfall events • Cloudiness change is largely unknown but expected to be small. Closely tied to relative humidity upper limit.
Modeling and Observational Consensus“An increasing body of observations gives a collective picture of a warming world and other changes in the climate system” - IPCC • Global average surface temperature has increased over the 20th century by about 0.6°C • The last decade of the 20th century was the warmest decade of the past millennium • Temperatures have risen during the past four decades in the lowest 8 kilometers of the atmosphere • Snow cover and ice extent have decreased • Global average sea level has risen and ocean heat content has increased
Science Challenges, Uncertainties, Issues • Software • Large, distributed development team • Aggressive schedule for improving science and performance • New coupling that allows multiple-executable concurrent and single-executable sequential • Regression testing with changing compiler, library, and OS versions • Earth System Grid and analysis framework for data dissemination • Uncertainties • Correction of model biases • Validation against observations for terrestrial carbon models • Scalability of algorithms • Reliability of simulation environment • Physics Models • Terrestrial biochemistry • Atmospheric chemistry • New ice-sheet component • Methods/Algorithms • Finite-volume atmospheric dynamics • Longitude-lattitude grid with FFTs at poles • Implement cubed-sphere grid • Decoupled parallelism for scalability and load balance • Atmospheric physics and dynamics • Ocean barotropic and baroclinic on generalized grids • Parallel I/O