Download
1 / 27
270 likes | 383 Views
Understanding. Perceived Performance. Tim Mangan Kahuna : TMurgent Technologies LLP http://www.tmurgent.com Microsoft MVP for Application Virtualization. President , Virtualization Boston http://www.virtg.com . Agenda. Computational VS Perceived Performance What D o Users Care About?

E N D
Understanding Perceived Performance Tim Mangan Kahuna: TMurgent Technologies LLP http://www.tmurgent.com Microsoft MVP for Application Virtualization President, Virtualization Boston http://www.virtg.com
Agenda • Computational VS Perceived Performance • What Do Users Care About? • Measuring Perceived Performance • Virtual Environment Performance
Computational Performance Measurement of discrete components of a system that affect overall performance. Examples include: • Processor time • Bandwidth • Queue lengths • Counters of all kinds
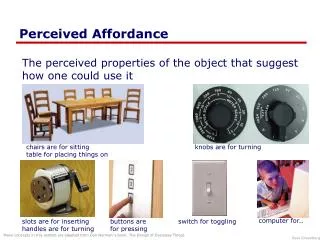
Perceived Performance A methodology where one analyzes the system with a goal of improving user productivity by focusing on issues that affect the performance as perceived by the users.
Differences in Techniques Computational Perceived • Repeatable • Break down to directly measurable components • Variable • Measure “end to end”
Bring in the “V” Word Our systems today are too complex to rely on computational performance (alone). • Multi-system • Networking • Remote Protocols • Virtualization Layering
Example Rethinking the Progress Bar1 • Good: • Linear • Fast Power • Bad: • Any with variation 1 Harrison, Amento, Kuznetsov, & Bell http://chrisharrison.net/projects/progressbars/ProgBarHarrison.pdf
Virtualization Reality Check1 1http://www.projectvrc.nl
Project VRC • Independent framework to measure virtual machine performance • Free • Set up your own tests • Understand their results • Virtual Session Index
Bare Metal 32-bit Office 2007 SP1 2003 versus 2008 x86 SWAP Space (RAID5) Add XenApp5.0 2003 versus 2008 x64
Hyper-V (version 1) Bare Metal vs VMs Odd Results TS versus Desktops
Vmware(Esx 3.5) Virtual Desktops Bare Metal vs VMs Page Sharing
It Depends… • Disk I/O Subsystem very important • Scenarios were CPU oriented • I/O subsystem of Hyper-V was bottleneck • New results being published soon • Improved Test Methodologies • New Vendor Releases
New! VRC 2.0 • Nehalem Rocks for TS! 2x Improvement • Hyperthreading great (except ESX) • EPT-D Rocks (Hardware vs Software) • if ESX and EPT-D, turn vMMU software off, • if ESX and no EPT-D, turn vMMU software on • New version Hypervisors did not improve much • Vsphere 4.0, Hyper-V 2.0, XenServer 5.5 • Hyper-V 2.0 improved more than others • Xen & Hyper-V now almost identical, except that a single VM cannot have 8CPU under Hyper-V (limit=4) • Vsphere can be better/worse than others depending on scenario • Office 2007 SP2 fixes “outlook preview pane” performance • IE8 performs on par with IE7
Links Project Virtual Reality Check: http://www.projectvrc.nl Perceived Performance: http://www.tmurgent.com/WhitePapers/PerceivedPerformance.pdf http://www.tmurgent.com/WhitePapers/PerceivedPerformance_VirtualOS.pdf VDI versus TS (video): http://www.brianmadden.com/blogs/videos/archive/2007/04/25/vdi-solutions-a-year-later-from-briforum-2007.aspx http://www.brianmadden.com/blogs/videos/archive/2007/10/09/xen-versus-esx-a-performance-head-to-head-comparison-from-briforum-europe-2007.aspx Citrix Logon and Logoff Chart: http://www.brianmadden.com/blogs/gabeknuth/archive/2008/08/14/briforum-video-the-excruciating-detail-of-the-xenapp-logon-process.aspx Here are some links most relevant to this topic.