Download

1 / 32
320 likes | 420 Views
Extrapolation of trial-based survival curves: constraints based on external information. Patricia Guyot 1,2 , Nicky J Welton 1 , AE Ades 1 Thanks to: M Beasley 3 1 School of Social and Community Medicine, University of Bristol 2 Mapi Consultancy 3 Bristol Haematology and Oncology Centre.

E N D
Extrapolation of trial-based survival curves: constraints based on external information Patricia Guyot1,2, Nicky J Welton1, AE Ades1 Thanks to: M Beasley3 1School of Social and Community Medicine, University of Bristol 2Mapi Consultancy 3Bristol Haematology and Oncology Centre BAYES2014, University College London, London 11th- 13th June2014
Why Extrapolate Survival Curves? • Health Technology Assessment requires a comparison of the expected quality-adjusted life-years between different technologies • A key element is difference in life expectancy • End-Of-Life criterion also require estimates of: • life expectancy • gains in life expectancy
Life Expectancy Difference • Difference in mean survival times • Can be calculated as the difference in areas between the curves over lifetime • But trials typically follow-up for just a few years • Mean survival times very sensitive to assumptions on what happens after the trial follow-up (in the “tails” of the curves)
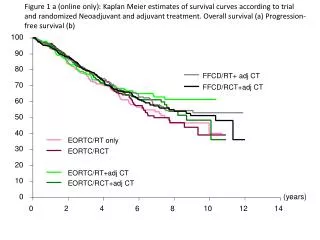
Cetuximab+Radiotherapyvs Radiotherapy for Head and Neck Cancer • NICE TA145 June 2008 • Bonner et al (2006) trial • 5-year follow-up
How to Extrapolate? • Need to assume something about: • the survival time distribution • Eg: Exponential, Weibull, Log-Normal ... • Cox models don’t help with this • the hazard ratio • proportional hazards (constant hazard ratio) • increasing or decreasing hazard ratio • “bath-tub” hazard ratio • Helps to have individual patient data, or sufficient statistics to explore alternative curves
Recontructing data from published Kaplan-Meier curves • Guyot et al. (2012) method to approximate the data used to produce kaplan-meier curves • Inputs: • Uses software to obtain co-ordinates from image from a .pdf file (we used digitizeit) • Numbers at risk published below the curve (defines fixed number of intervals) • Total number of deaths/events (if reported)
Cetuximab: Locoregional Disease Control Reconstructed KM data Original publication
Back to Extrapolation ... • Using reconstructed data we can estimate a variety of different survival models ...
Assessing Fit to Trial Data Doesn’t Help Mean Survival Difference: Log-normal FSEA: 80.4months (2.0,237.0); DIC=2314 Log-normal AFT: 32.3months (-3.1,78.6); DIC=2315
Possible Solution: Use External Data To Inform Extrapolation • Observational evidence e.g. • General population • Registry (e.g. Surveillance Epidemiology and End Results) • Other RCT evidence e.g. • Meta-analyses (e.g. Pignon et al. 2009) • longer RCTs • Expert opinion
Estimation • Model RCT and external data simultaneously with linked parameters • Bayesian approach • Eg constraint that general population overall survival better than that in Bonner control arm • Linking function: • Prior:
Matched General Population (Expect OS better than Bonner Control Arm) • Rules out all parametric models • We used flexible spline models (Royston & Parmar (2002))
Expert view on Bonner trial • In H&N, relapse is high for first 2 years, and then declines • Effect of cetuximab is to increase the proportion of cells sensitive to radiotherapy and so lower the risk of relapse • Duration of treatment effect should be the same as the time interval over which the relapses occur • Those who die of H&N cancer tend to die in first 5 years • Conditional survival in both arms should “stabilize” and converge after 5 years (i.e. HR tends to 1)
All Constraints • Control arm overall survival less than matched UK general population • 1-year conditional survival in control arm is no different to that in SEER database • Hazard ratio tends to 1 as time from treatment increases
Implementation: Gen Pop Survival • Likelihood for the external data: • r: number alive at time T; n: number at risk at time 0 • Linking function • Overall survival , e.g. • Prior: • Constrain general population survival to be better than that for advanced head and neck cancer patients
Implementation: SEER 1-year Conditional Survival • Belief that 1-year conditional survival on radiotherapy equal to that from SEER • Linking functions • Binomial likelihood (each time-point conditionally independent) • 1-year Conditional survival on control arm
Implementation: HR tends to 1 • Belief that HR tends to 1 • Likelihood for the external data • Normal for external HR • Linking functions • Normal likelihood for hazard ratios: • Hazard ratio of treatment vs. control
Results: Overall Survival Kaplan-Meier Matched General Population Constrained Extrapolation
1-year Conditional Survival Kaplan-Meier Matched SEER Constrained Extrapolation
Overall Survival Difference in life expectancy: 5 months [95%CrL: 0; 9]
Discussion • Spline models tricky to estimate • Possible alternative flexible models include fractional polynomials, mixture models • Relies on identification of relevant external evidence sources • Clinical input essential to help identify relevant sources
References • Bonner et al. 2006. NEJM 354: 567-78 • Pignon JP et al. 2009. Radiotherapy and Oncology 92:4-14 • Surveillance, Epidemiology, and End Results (SEER) Database (www.seer.cancer.gov) • Guyot P, Welton NJ, Ades AE. Enhanced secondary analysis of survival data: reconstructing the data from published Kaplan-Meier survival curves. BMC Medical Research Methodology 2012. 12:9 • Royston P, Parmar MK. 2002. Stats in Med 21:2175-2197