Download
1 / 37
370 likes | 653 Views
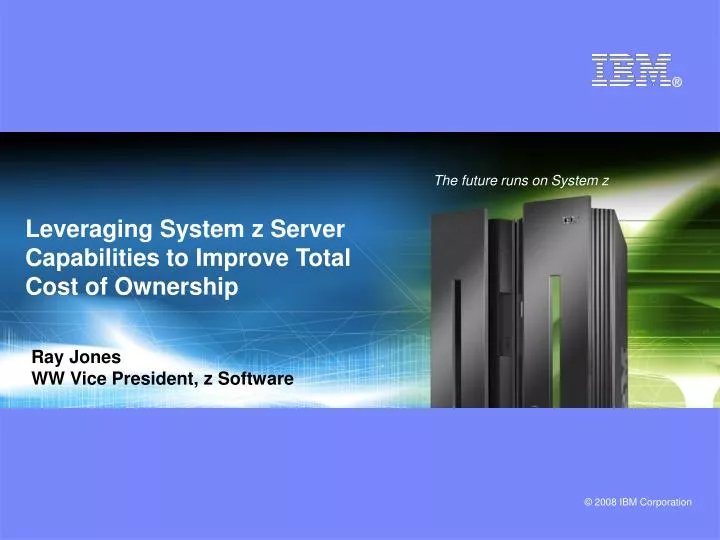
The future runs on System z. Leveraging System z Server Capabilities to Improve Total Cost of Ownership. Ray Jones WW Vice President, z Software. Let’s Break Down the Elements of Cost. Total Cost of Ownership = Hardware/Maintenance + IBM Software + Environmentals + Labor

E N D
The future runs on System z Leveraging System z Server Capabilities to Improve Total Cost of Ownership Ray Jones WW Vice President, z Software
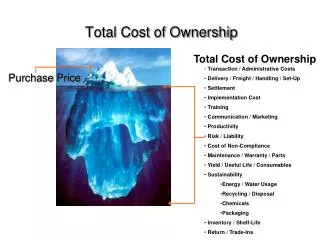
Let’s Break Down the Elements of Cost Total Cost of Ownership = Hardware/Maintenance + IBM Software + Environmentals + Labor + required Quality-of-Service (Availability, Security, Disaster/Recovery…) + other Elements (Chargeback) The total cost requires a total picture of your I/T assets and expenses
Mainframe Cost/Unit of Work Decreases as Workload Increases Most businesses operate here, often running thousands of applications Most TCO benchmarks compare single applications Cost per unit of work Mainframe Distributed scale out Data Center Workload
Observed Consolidation Ratios Cost Per Image = 1/N A little consolidation is good More consolidation is better Cost Per Image VMware Intel System z Power Systems N
Application specific storage allocations tend to occur in large units… resulting typically in single digit utilization Utilization of Distributed Servers & Storage Provision capacityfor peak workload Typical utilization of: Windows Servers 5-10% UNIX Servers 10-20% System z Servers 85-100% Server dedicated to one application Idle Resource Idle Resource The cost of storage is typically three times more in distributed environments • Storage Allocation • Application-specific resulting in over-allocations • Fine grained storage allocation mechanisms characteristic of mainframe storage are uncommon in distributed environments. • Storage Utilization • Single digit utilization for distributed environments is not uncommon • Storage utilization of 80% + is typical for mainframe • Storage Management • Data disaster recovery, synchronization, and transfer requirements add complexity and cost
What Is A Typical Value Of Sigma? IBM Survey Of Workload Variability In 3200 Servers Characterization of Workloads Based on analysis of over 3200 customer servers IBM System x™ Servers and VMware Virtual Machine Sizing Guide Legacy workloads on XEON 2.5-2.8GHz Servers 6 Normal probability distribution 6
New Workload Scenarios – Beware Benchmarks Stress test benchmarks have no variability! They drive the system under test to100% utilization with no variation Comparing mean throughputs at 100% utilization doesn’t give a realistic view of the resources required for deployment Running a new workload with variability Sigma=2.5*Mean requires processing capacity equal to 6 times the Mean workload demand Adding a new workload to a pool of 256 existing workloads will require incremental processing capacity equal* to the Mean workload demand 7 * If we add one more workload to a pool of 256 consolidated workloads the computing resource required for the pool goes up by 1.00047 * Mean
Compare The Processors Needed To Achieve 2,200 Transactions Per Second Online Injector: 1 x HP RX7620 TCS BaNCS and DB2 1x z10 2097-705 5 processors (3,906 MIPS) Processor Temenos T24 Servers: 2 x HP RX7620 3 x HP 9000 Superdome Processor Processor Processor Processor 280 processors (457,762 Performance Units) $18.9M TCA (3yr) $26.0M TCA (3yr) 117 Performance Units per MIP Oracle 10g: 1 x HP 9000 Superdome HP Integrity rx7620 - (10U) 1.5GHz 6MB (8ch/8co) HP 9000 Superdomes -32W 1GHz 32MB (32ch/64co)
Compare The Processors Needed To Achieve 2,200 Transactions Per Second (with Dev/QA) Online Injector: 2 x HP RX7620 TCS BaNCS and DB2 1x z10 2097-707 7 processors (4,906 MIPS) Processor Temenos T24 Servers: 4 x HP RX7620 6 x HP 9000 Superdome Processor Processor Processor Processor Processor Processor 560 processors (915,524 Performance Units) $22.7M TCA (3yr) $59.2M TCA (3yr) 187 Performance Units per MIP Oracle 10g: 2 x HP 9000 Superdome NOTE: Double Distributed Servers, add 1000 MIPS to System z for Dev/QA HP Integrity rx7620 - (10U) 1.5GHz 6MB (8ch/8co) HP 9000 Superdomes -32W 1GHz 32MB (32ch/64co)
Benchmark - Code Expansion When Moving From CICS/Cobol To Java On Wintel (Higher Is Worse) 4.9 times instruction expansion 12.6 times cycle expansion Instructions per Transaction per Processor X Series X366 Server 4 X 3.66 GHz 12 GB RAM LoadGenerationClients IBM X445 Server8 x 3.GHz 16 GB RAM 2 RAID Arrays Database System z9-BC 4 X 1.428 GHz 64 GB RAM Source: SWG Internal Measurements IBM Confidential
Replacing existing legacy application with web-based customer facing application 3. Reuse applications and data Top three reasons for savings Development Cost Complexity of recoding from scratch all the business processes into .net framework Years 2 3 $38M 94%Savings Speed of implementing System z solution was less than 29 days Year 1 Year 1 Additional employees to test and maintain .net application versus none for System z $2M .net app onIntel Reuse applications on System z A medium-sized financial services vendor Additional benefits Improved application functionality Faster time to market Quick implementation and reduced risk
Bank of China BMT* IBM System z9 TCS BaNCS (Cobol) 380 Million Accounts End of Day processing – 175M accounts finished in 55 minutes (52,970 accounts/second) HP/Temenos BMT** HP Itanium Temenos T24 (Java) 13 Million Accounts End of Day processing finished in 13.33 minutes (16,250 accounts/second) System z Batch Processing Performance End of Day Batch Processing Accounts Per Second 3.3 times faster Z9 BaNCS HP Temenos SOURCE:*http://www.enterprisenetworksandservers.com/monthly/art.php?2976 Source: InfoSizing FNS BANCS Scalability on IBM System z – Report Date: September 20, 2006SOURCE:**TEMENOS BENCHMARKS; http://h71028.www7.hp.com/enterprise/downloads/TemenosBenchmark.pdf
Disaster Recovery – Fast Failover For Less Pay regular price for one active processor to enable fast failover Primary Site Alternative Site 64 way SMP 64 way SMP Pay much less for each dormant processor to maintain capacity back up on demand Pay regular price for frame Site Failover With GDPS Note: other scenarios can reduce the price further
Backbone Case Study: Network Costs –Before Consolidation (483 Servers to 2 System z’s) Hardware Acquisition $748K Network Annual Costs $597K Shows 30 of the 483 Servers
Backbone Case Study: Network Costs – After Consolidation (483 Servers to 2 System z’s) New Hardware Acquisition $0 (reuse some of old network hardware) “After” Network Annual Cost $253K Network Annual Cost Savings $344K
IBM Software Price Per Transaction is Going Down Putting This in Perspective • For a typical system of 1,400 MIPS, MLC software stack costs $59 per incremental MIP • If a transaction is 1 million instructions, an incremental MIP can perform >2½ million additional transactions per month for Δ$59 software cost (44K transactions per dollar) • If these are credit card transactions of average $100 with a commission of 2%, the business makes $5.2M per month for a software cost of $59 per month (88,000 times return) • If this is a bank account averaging 3 transactions a day, the business can do 40 years of account management for a software cost of $1
Incremental Cost Of New Workload Can Be Isolated Using Sub-Capacity Pricing… Incremental Cost Existing Cost Linux Image Linux Image Application Application Application DB2 Application Application Application DB2 DB2 New Application Linux Image z/OS z/OS z/OS z/OS z/VM Pay for the peak usage of the software in this partition Additional MIPS do not increase the cost of IBM software in other partitions All Data 17
…Or On zLinux With IFL Pricing Existing Cost Linux Image Linux Image Application Application Application DB2 Application Application Application DB2 DB2 Application Application Application Linux Image z/OS z/OS z/OS z/OS z/VM Incremental OTC payment per IFL core Does not increase the cost of IBM software in other partitions All Data 18
Specialty Engines Reduce CostFor New Workloads Special assist processors for System z For Java workloads (zAAP) For selected DB2 workloads (zIIP) For Linux workloads (IFL) Attractive pricing $125K for a 920 MIP processor (90% discount) No charge for IBM software running on zAAP/zIIP IBM software running on IFL costs 120 PVU’s Free upgrade to next generation! Requirements Max number of zAAP =< number of general purpose processors Max number of zIIP =< number of general purpose processors No limit on the number of IFL’s 19
International Restaurant Chain Avoids High Cost Software • Existing environment of 1600 MIPS included high cost ISV system management software • Competitor’s proposal was only a partial offload • Complete offload projected to cost 2.3x more • $56M vs $24M over 5 years • System management software costs more in the offload case • Mainframe systems management • $2.0M Stream per year (48 products, mostly third party) • Distributed systems management • $2.6M Yearly Maintenance (26 products) • $13.3M One Time Charge • Better: Replace higher cost System z ISV software with lower cost IBM Software IBM Confidential
Portfolio Review and Analysis "PRA" - a study for IBM zSeries customers • helps understand the potential impact of processing growth on future software budgets by developing predictive costs models. • provides you with a comparison of your current portfolio cost structure with those of other zSeries/S390 customers. • analyzes your software portfolio to identify redundant or underutilized software products. • identifies product alternatives and their cost/ benefit impact. • provides you with negotiation leverage with incumbent product vendors. • provides you with the latest Software Asset Management tips to help proactively manage your zSeries/S390 software portfolio • http://www-3.ibm.com/software/solutions/softwaremigration/sps.html • Or contact Linda Beckner at (614) 659-7192 or at Becknel@us.ibm.com.
z10 Consumes Less Power Than Superdome HP Superdome64 chips/128 cores IBM z10 E64 IBM z10 E56 HP 2.5 Times Power Consumption System z IBM z10 E40 IBM z10 E26 IBM z10 E12 IBM z10 E12-509 8.5 Times Scalability
Do The Math • HP Itanium 2 Superdome 9050 (64ch/128co)* consumes a maximum of 24,392 watts • [24,392 X $.10 X (24 X 365)]/1000 = $21,367 per year for electricity • Mainframe with similar computing capacity - a System z10 704 machine with 2 I/O cages using 13.26 kW (rated)* • $11,615 per year for electricity • Similar savings on cooling capacity • Cost of cooling is about 60% additional • Superdome total $34,187 per year vs. Mainframe $18,585 • Savings of mainframe power and cooling is $15,602 per year * Performance equivalence determined by IBM TCO study
IBM Storage Also Saves Energy Costs IBM DS8300 Power Consumption vs. EMC DMX-3 by Size 25 91.25 TB 20 68.44 TB 54.75 TB 15 34.33 TB 18.25 TB 10 Power (KVA) 5 0 28.06 TB 37.41TB 22.45 TB 7.48 TB 14.03 TB IBM DS8300 922+92E EMC Symmetrix DMX-3 Study used 146 GB 15K rpm drives
The Mainframe Also Delivers More Compute Power Per Footprint Unit IBM z10-717 IBM z10-711 Performance Units 319 Sun Fires HP 9050 32/64 157 Sun Fires HP 9050 64/128 IBM z10-705 22 Sun Fires HP 9050 16/32 5.8 10 30.4 29 10 30.4 52.2 20 30.4 Approximate footprint (sq ft) Based on 122 performance units per MIP Mainframe footprint remains constant
Customer Survey – How Many People to Manage Servers? Mainframe administration productivity surveys range 167-625 MIPS per headcount (500 is typical), so… Source: IBM Scorpion Customer Studies NOTE: Figures for total administration cost
4x more workload per person Manage More Workload Per Headcount Compared at 122 RPE’s = 1 MIP
Properly account for your costs “False Economics”: Over-allocation of Costs to System z Getting to “True Economics” Mainframes Intel/UNIXServers • Core problem • Difficult to assign shared costs to platforms • Shared costs lumped in with mainframe costs • Thus, mainframe costs tend to be overstated • Platform decisions are made that waste cash Direct Costs Hardware, Software, Admin $ $ Correct allocation Correct allocation $ Shared Costs Power, Facilities, Network, Mgmt overhead, etc. • Pragmatic quick-return remedy Incorrect, zero allocated Correct allocation • Meter basic usage • Identify largest cost distortions • Incorporate information in decision making +$ All of Intel/UNIX incurred costs are moved to mainframe
Understand The Cost Components Annual Operations Cost Per Server (Averaged over 3917 Distributed Servers) The largest cost component was labor for administration 7.8 servers per headcount @ $159,800/yr/headcount Source: IBM internal study IBM Confidential
How Does Consolidation Reduce Costs? The more workloads you can consolidate, the lower the cost per image 1.0 • Costs shared by all “N” consolidated images • Hardware • Software • Power • Floor Space • Local Network Connectivity • Costs not shared by consolidated images • Migration cost per image • Off premise network cost • Labor cost per image Cost per Image = 1/N .5 Cost Per Image .33 .25 .20 .1 N Fixed cost per image Fixed cost per image, but typically less than unconsolidated labor cost 30
Deploying SAP database and application servers Optimize deployment of applications and data Top three reasons for savings 42%Savings (in less than 2 years) Years 2 3 Software and hardware licensing costs dramatically reduced $14M $8.1M Year 1 PreviousIT Budget Software and hardware maintenance costs are significantly down 2008 IT budget Year 1 Networking costs plunged, while infrastructure was drastically simplified Windows/Unix Servers System z $1.8 billion Electric motors manufacturer
Expected Benefits Realized: Availability and Performance The System z decision was driven by expected benefits: System z Decision • Reduced complexity • High availability • Ease of maintenance • Dynamic Workload • Good consistent application response time (SAP) • zLinux for rich toolset, ease of use Additional Benefits Realized: Significant Cost Savings • Reduced IT budget by 42% - in less than 2 years • Reduced floor space by 70% • Reduced software and hardware maintenance by more than 50% • Reduced power consumption by more than 60% • Reduced total TCO from 2% of sales to below 1% - and realized 1 year ahead of schedule
Key Points: This pricing discussion uses published list prices
Eagle Studies A Total Cost of Ownership analysis study with your customer Cost and risk analysis on mainframe vs alternatives Tailored to individual customer needs Cost factors unique to each enterprise Costs evaluated over five-year period A Typical Study Focusing on TCO Project preparation – Eagle team works with local IBM team On-site information gathering (1 day) Report prepared offsite by IBM (in 2 weeks) Presentation of report NO CHARGE for this service For more information contact IBM sales lead or Craig Bender at csbender@us.ibm.com 35
TCO Lessons Learned Distributed platforms require more resource Path length expansion – COBOL to Java (4x) Database expansion – Hierarchical to Relational (3x) No I/O subsystem offloading (2x) Headroom required for workload variation (6x) Software pricing Server consolidation reduces software costs with fewer cores Core based pricing also increases cost of system management tools on distributed platforms Commonly overlooked distributed costs Complexity of disaster recovery Server refresh Overlapped servers during server life cycle System support staff Commonly overlooked mainframe advantages Sysplex advantages in MLC pricing and disaster recovery I/O bandwidth and I/O subsystem advantages for batch processing and consolidation System management and security “Free Capacity” if peak calculation for sub-capacity is not affected Customer Environment Inaccurate chargeback puts mainframe at disadvantage Data centers run out of space and power capacity 36
System z clouds achieve operational efficiency through economies of scale Clouds built on mainframes can deliver economies of scale by using less resources while delivering more workload capability Dramatic Simplification through Virtualization Project Big Green view of TCO results in potential 60-75% gross cost savings over 5 yrs