Download
1 / 48
480 likes | 485 Views
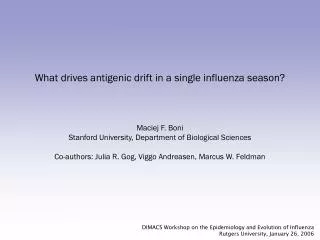
VACCINATION POLICY AND ANTIGENIC DRIFT IN INFLUENZA A (Preliminary Draft). Sarah Cobey (UChicago EE) Anup Malani (UChicago Law) Frank Wen ( Uchicago EEB, Med School). Overview.

E N D
VACCINATION POLICY AND ANTIGENIC DRIFT IN INFLUENZA A(Preliminary Draft) Sarah Cobey (UChicago EE) Anup Malani (UChicago Law) Frank Wen (Uchicago EEB, Med School)
Overview • Prior literature on seasonal flu vaccine examines present and future private benefits, private and social impacts, and economic valuation given private and social benefits. • Unlike, e.g., measles, flu evolves. Prior lit on flu evolution assumes it is independent of vaccination, but theoretically implausible. Prior estimates of vaccination value don’t account for evolution, because small scale studies. • We modify a previously validated model of flu evolution to account for evolution due to flu. (Cannot use real data because genetic data hard to gather. Cannot use trials because evolution is at societal scale.) • We analyze “data” from simulation to estimate the private and social benefits of vaccination with and without accounting for evolution.
Preview of results Impact of vaccination on evolution is theoretically ambiguous, but the computational model suggests… • For plausible parameter values, vaccination on average reduces antigenic drift (positive social effect), but may increase the variance of drift (conditional on negative social effect, bigger negative effect). • By increasing social benefit, evolution due to vaccination may reduce private incentive to vaccinate.
Influenza A (H3N2) • Influenza has substantial morbidity and mortality costs (WHO 2014). • Influenza infects 5-10% of adults, 20-30% of kids annually worldwide. • 3-5 million cases of serious sickness and 250,000-500,000 deaths annually worldwide. Morbidity rising over time (Thomson et al. 2004). • Economic burden is ~$87b/year in US (Molinari et al. 2007). • Majority of morbidity, mortality due to Type A influenza (specifically H3N2, which emerges in 1968). • Flu circulates globally. • Typically starts in East, South and SE Asia, spreads to N. America and Europe, then S. America (Russell et al. 2008, Bedford et al. 2015). • Flu is seasonal in temperate regions, epidemic but aperiodic in tropics (WHO 2014). • All flu strains are constantly evolving. • Acquire mutations in the major surface protein (epitopes in the hemagglutinin protein) that allows then to escape binding by antibodies.
H3N2 is evolving in a relatively linear path Much of drift can be captured in 2 dimensions. This is called canalization. Antigenic locations of A/H3N2, A/H1N1, B/Vic, and B/Yam viruses showing evolutionary relationships between virus samples. Circles represent a posterior sample of virus locations and have been shaded based on year of isolation. Antigenic units represent twofold dilutions of the HI assay. Absolute positioning of lineages, for example A/H3N2 and A/H1N1, is arbitrary. Lines represent mean posterior diffusion paths when virus locations are fixed. Source: Bedford et al 2014 (Fig. 2)
Private benefits of vaccination • Best means of preventing flu infection in the current seasonis vaccination, but the protection is imperfect. • Low average vaccination rates. Moderate rates in N. America and Europe (UK 75%, US/France/Germany 50-60%, EE 10-20%), but only recently (CDC 2013, ECDC 2014). • Even perfectly targeted vaccines may be ineffective. 47% chance of infection even with vaccination (Ohmit, Thompson et al. 2014); higher in McLean, Thompson et al. (2014). Less effective in elderly (Goronzy et al. 2001, Simonsen et al. 2005). • Imperfect targeting. • Vaccine created from existing strains but deployed after 9-12 months later; by then flu may have evolved. Vaccination “lags behind” mutated strains. • Strains selected for vaccine each year can mutate during incubation. • Cross-immunity from prior vaccinations reduces risk from infection by mutated strains in future seasons. • But cross-immunity declines with the distance flu has evolved in antigenic space from the prior infection or vaccine strains. • Vaccine effectiveness is 56% in current season and 18% in prior seasons (Ohmit, Thompson et al. 2014). But see McLean et al. (2014), finding no difference.
Social benefits and economic studies Vaccination has social effects Flu is contagious. E.g., school holidays (social distancing) interrupt flu epidemics (Glezen 1982). Vaccinating children has benefits for adults. Tecumseh, MI, study showed benefits to adults from vaccinating children (~border identification, but just 2 towns). See also Ghendon et al. 2006 (4 nbhds in Moscow), Glezen et al. 2010 (counties in TX). Benefits to teachers (Rudenko et al. 1993, but only for live attenuated vaccine); to family contacts (Hurwitz et al 1990). Reichert et al. 2001 showed that discontinuation of Japanese school vaccination in 1994 led to increase in elderly mortality. Loeb et al. 2010 (RCT in Hutterite communities) found indirect vaccine effectiveness of 61%! But not estimate private benefit, so can’t compare. But see Cowling et al. (2010) and Clover et al. (1991) (finding no social effect, but smaller sample). Prior economic studies account for externalities, but not evolution Computation models suggest vaccinating 40% of children can reduce mortality and morbidity in elderly by 70% in US (Weycker et al 2005). See also Boulier et al. (2007), Baguelinet al. (2012) (56-73% of cases prevented due to social benefits), Gibson et al. (2016). Estimate economic benefits as well. Positive (static) externalities lead to private under-consumption of vaccine (e.g., Geoffard and Philipson 1997). See also Kremer & Snyder (2006) on producer incentives. Francis (1997) and Brito et al (1991) examine optimal subsidies.
Prior literature on flu evolution • Bulk of the literature on vaccination is evolutionarily static, focusing on distribution of vaccines this season (e.g., Medlock and Galvani 2009), ignoring evolution. • Even focus on future season effects assumes evolution independent (e.g., Ohmit, Thompson et al. 2014, McLean et al. 2014). • Evolutionarily dynamic analysis has two strands. • Targeting of vaccines given exogenous evolution (E.g., WHO Writing Group, Ampofo et al. 2012, Carrat and Flahault 2007, Fonville, Wilks et al. 2014). • How vaccination affects flu evolution (next slide).
Prior literature on flu vaccination & evolution • Theoretically possible. • Generic analysis (Mclean 1995, Gandon, Mackinnon et al. 2003). • Difference between antibiotic resistance and vaccine resistance is former targetted at killing target with chemicals, latter at getting immune system to kill target. • Flu evolves to escape prior immunity, natural or (adjuvant) vaccine-triggered humoral (mainly antibody) immunity should not make a difference (illustration in 2 slides).* • Boni, Gog et al. 2004 show higher vaccination rates reduce escape. • Arinaminpathy, Ratmann et al. 2012 show vaccination that targets viral shedding rather than infection reduced drift. But such vaccines not yet developed. • Little empirical evidence (Boni 2008). • Some evidence in Mexican poultry (Lee, Senne et al. 2004). • Evidence of vaccine resistance in polio (CDC 2000), hep B (Carman et al. 1990, Zuckerman 2000), S. pneumoniae (Pai et al. 2005), H. influenza (Adam et al. 2010), Mareks disease in chickens (Gimeno 2008). • By contrast, plenty of theoretical and empirical literature of evolutionary response of bacteria to antibiotics(e.g., Lipsitch & Samore 2002). • Our work is similar to Poolmanet al. (Vaccine 2008) on HPV vaccination and evolution, but focus is not on the evolution of disease as much as cost to hosts.
Overview • We examine the effect of infection-preventing vaccination (relative to natural immunity) on the antigenic drift of influenza A. • We add immunity and cross-immunity from vaccination to an existing computational model of influenza evolution in 1 region. • This model is a first step towards a global model with multiple regions. • We use it to study the effect of different biological and policy parameters: • The relative cross-immunity from vaccination (v. natural immunity), • The vaccination rate, • The distribution of mutation size, • The error rate in vaccine targeting. • We examine the impact on incidence, a measure of private and social benefit.
Illustration of drift due to immune escape Flu starts here in one person in season t
Illustration of drift due to immune escape Infection generates cross immunity wider than the infection
Illustration of drift due to immune escape Mutations emerge by season t+1. Some escape cross immunity (blue), of those escapee some thrive (green). (There could be multiple that thrive, we focus on one for illustration.) We show asymmetric mutations because we know flu follows a relatively linear pattern, partly because back tracking is limited by cross-immunity from seasons prior to t. We don’t fully understand why.
Illustration of drift due to immune escape This is the antigenic drift of flu due to escape from natural immunity
Illustration of drift due to immune escape But cross immunity might also have arisen from a vaccine strain (purple) in season t
Illustration of drift due to immune escape So this antigenic drift could also be due to escape from vaccine-acquired cross-immunity
What is cross-immunity? • The cross-immunity is the extent to which previous infections or vaccinations reduce the probability of infection by mutated strains. Cross immunity from vaccination (relative to infection) has two parts. • Breadth of cross-immunity: Assuming that time t vaccine is perfectly targeted at time t circulating strain, how much does it protect against infection by time t+1 circulating strain • Lag targeting error: Time t vaccine may not be targeted exactly at time t circulating strain. The error reduces effective cross-immunity if the circulating strain evolves in one direction and vaccine targeting error goes in different direction, which is likely the case.
Intuition behind vaccination-induced drift • The extent of antigenic drift is a positive function of the number of mutated strains and extent of cross-immunity from prior infections/vaccination. Vaccination interacts with each factor. • First, the greater the incidence of flu infection the greater the number of mutant strains. Vaccination reduces drift by reducing infections. • Second, the effective cross-immunity from vaccination (relative to natural immunity) has mixed effects. • The less the breadth of effective cross-immunity or the larger the lag in effective cross-immunity, the more likely a mutated strain will escape that cross-immunity, and thus more drift. • The less the breadth in effective cross-immunity, the less far a mutated strain must travel in antigenic space to escape, and thus less drift.
Illustration of effects from effective cross-immunity Escape with directional drift and lag targeting Escape with more cross-immunity Escape with less cross-immunity Panel A: Immune breadth Panel B: Vaccine lag Escape with no lag targeting Antigenic distance relative to last targeted strain Antigenic distance relative to last targeted strain 0 0 Escape with less dispersion Escape with moredispersion The figures show distribution of mutation size (distance travelled by mutation). Panel A: Wider cross-immunity (dashed line) reduces the probability of escape, but also increases distance traveled conditional on escape. Panel B and C: Lag targeting (dashed line, Panel B) and greater dispersion (dashed line Panel C) increases probability of escape. Panel C: Dispersion of mutations Antigenic distance relative to last targeted strain 0
Overview • We add vaccination to a validated, large-scale individual-based model (Bedford, Rambaut et al. 2012) that simulates stochastically open-ended antigenic evolution of the viral population and the acquisition of strain-specific immunity in individual hosts. • Host and virus states are updated daily. The simulation is run for 20 years of model time. • 1 region with 50 million hosts. The population size remains fixed though there is a common rate of births and deaths of hosts of 1/30 years per host. No morbidity or mortality from flu.
Immunity and vaccination • A virus’s antigenic phenotype is a location in a two-dimensional antigenic space. • A host’s immune system remembers the phenotype of each virus it encounters, by infection or vaccine. • Once a year (Jan 1), a new strain is selected for the vaccine by taking the average of the antigenic locations of circulating strains weighted by their abundances. • Hosts are immunized with this new vaccine strain at a constant per capita rate per day starting immediately after 10 months for a period of 4 months (Oct 1 – Jan 31).
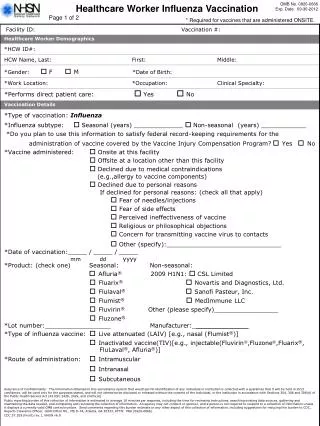
Infection • Similar to an SIS model. Individual contact rate (mean per host per day) with no seasonal forcing. • The risk of infection given contact by circulating virus is where is distance from the circulating virus’s phenotype to the closest infecting phenotype in the host’s immune memory, is distance of the closest vaccine strain with which the individual has been immunized, and scales the strength of immunity from vaccination versus natural infection. Immune breadth varied by varying : is immune breadth 1, is immune breadth ½, etc. • Cross-immunity equals . • The host recovery rate is per day, implying 5-day duration of infection and an in a naïve host population.
Mutation • The initial viral population had 10 infections, each with identical phenotypes. • Viruses evolve through mutation. Each day, the probability a virus mutates to a new phenotype is . The antigenic distance travelled by the mutation, i.e., the size of the mutation, is an i.i.d. draw from a gamma distribution, which in our base case had mean 0.6 and standard deviation 0.3 antigenic units. • To focus on runs that had a degree of survival and canalization in actual H3N2 phylogeny, we only analyzed runs in which strains did not subsequently go extinct and time to most recent common ancestor (TMRCA) < 10 years (Bedford, Cobey et al. 2011).
Limitations • (For now) we examine 1 region. With reseeding from, e.g., Asia, evolutionary dynamics change. • We have no age structure, unlike prior studies showing social benefits from vaccinating children. • Bedford et al. (2012) is calibrated with a largely unvaccinated world. We use that in a vaccinated world. Maybe there would be diversification (multiple weakly related strains) if Asia were to vaccinate.
Antigenic drift in our simulations “looks” realistic Simulation without vaccination Greyed out strains are extinct Black strains are currently circulating Blue strains are the ones that would be selected for a vaccine (were there to be vaccination)
Antigenic drift in our simulations “looks” realistic Simulation without vaccination Greyed out strains are extinct Black strains are currently circulating Blue strains are the ones that would be selected for a vaccine (were there to be vaccination)
Antigenic drift in our simulations “looks” realistic Simulation without vaccination Greyed out strains are extinct Black strains are currently circulating Blue strains are the ones that would be selected for a vaccine (were there to be vaccination)
Antigenic drift in our simulations “looks” realistic Simulation without vaccination Greyed out strains are extinct Black strains are currently circulating Blue strains are the ones that would be selected for a vaccine (were there to be vaccination)
Antigenic drift in our simulations “looks” realistic Greyed out strains are extinct Black strains are currently circulating Blue strains are the ones that would be selected for a vaccine (were there to be vaccination)
Results Graphical illustration of simulation dynamics
Evolution matters Solid line is average across simulations. Dotted line is simulations that do not go extinct. Yellow lines are sims blocking any evolutionary effect of vaccination. Purple lines are sims allowing evolutionary effects of vaccination. *These are not the exact simulations we use in regressions. Here relative immune breadth of vaccine immunity v. natural immunity is 1. Moreover, we have 500 sims per vaccination rate for 40 rates.
Greater vaccination reduces average drift, but surviving populations may evolve farther Solid line is average across simulations. Dotted line is simulations that do not go extinct. *These are not the exact simulations we use in regressions. Here relative immune breadth of vaccine immunity v. natural immunity is 0.1. Moreover, we have 500 sims per vaccination rate for 40 rates.
Greater breadth reduces average drift, and populations evolve less far Solid line is average across simulations. Dotted line is simulations that do not go extinct. *These are not the exact simulations we use in regressions. Here relative immune breadth of vaccine immunity v. natural immunity is 1. Moreover, we have 500 sims per vaccination rate for 40 rates.
Caveat: we trim results to ensure canalization To ensure that our sims produce H3N2 evolution that is realistic, we drop sims where there are multiple strains for which the “time since the most recent common ancestor” (TMRCA) is greater than 10 years. Figure to right shows that the fraction of sims with this problem grows with vaccination rate. So, if anything, we overestimate the extent to which vaccination induces faster evolution. There is canalization in the real world. But there is very little vaccination in the real world, and lots in our model. Our analysis suggests, if anything, canalization will become more prominent as vaccination rates rise in Asia.
Private benefit from vaccination Private benefit is risk of infection with vaccination (red) v. without vaccination (blue). As the vaccination rate rises, the private benefit of vaccination, in theory, could fall or rise. Fall because less need to vaccinate if others vaccinate Rise because vaccination rate reduces antigenic drift On average the evolutionary effect is larger
Private benefit from vaccination Private benefit is risk of infection with vaccination (red) v. without vaccination (blue). As the vaccination rate rises, the private benefit of vaccination, in theory, could fall or rise. Fall because less need to vaccinate if others vaccinate Rise because vaccination rate reduces antigenic drift (see figure to right) On average the evolutionary effect is larger
Social benefit from vaccination Social benefit of vaccination is risk of infection conditional on no vaccination, with positive (red) versus zero vaccination rate (blue). Positive externality falls with drift. Faster drift means that distance between infecting strain and your last infection or vaccine strain is larger, increasing risk of infection. Since vaccination rate reduces drift, it increases the positive externality.
Social benefit from vaccination Social benefit of vaccination is risk of infection conditional on no vaccination, with positive versus zero vaccination rate (red v. blue). Externality falls with drift. Faster drift means that distance between infecting strain and your last infection or vaccine strain is larger, increasing risk of infection. Since vaccination rate reduces drift, it increases the externality.
Results Estimation of private and social value of vaccination
Output from computational model • Run 20 sims for each of 5 vaccination rates (0, 0.01, 0.05, 0.1, 0.2) • Run each sim 2 ways: dynamic and static • Dynamic allows evolution • Static pairs each positive vaccination rate sim with a 0 vaccination rate sim and each time host in former sim contacts a strain, strain location is selected from the latter sim • Drop first 3 years of each 20 year sim, to eliminate transition dynamics • Sample 1% of all hosts (otherwise we have 200b hosts, minus sims dropped because TMRCA violation)
Regression to generalize from sim output • We estimate the following for static and dynamic sims separately: • Do not include past infection history as it is orthogonal to vaccination in the simulation. No omitted variable bias. • Include random effects and clustering to account for omitted vaccination and infection history. • Cluster at sim level to allow for infection across people and time. • We estimate a model that pools static and dynamic sims, add a dynamic main effect, and interacts regressors above with a dynamic dummy, in order to compare the models
Economic value of vaccination Baseline infection rate is ~10% (without vaccination and vaccination rate = 0%) Private benefit is much larger than social benefit (perhaps in contrast to prior lit). At IB = 1 and VR = 5% in dynamic sim, PB = -10% but SB = -5.7%/2.5mil Own vaccination is more effective in the static model (significant at IB = 1). Own vaccination is less valuable when vaccination rate is more effective. Vaccination rate is more effective in dynamic model. Own vaccination can have a larger future effect (at IB = 1 dynamic model, current value is -3.3%, future value is -7.7%) At high IB, dynamic model shows significantly lower private and higher social value to vaccination (at IB = 1, VE is 50% greater in static model, 5% vaccination rate is twice the value in dynamic model)
Conclusion • Interesting implications. • Vaccination may exacerbate free riding problem if it increases social benefit and reduces private benefit of vaccination. • If vaccination (occasionally) increases drift, may cause N. American and European strains to seed to rest of world. • Limitations • Need to add age-structure to map to prior literature’s estimates of externalities. • Need to examine multiple regions with variable vaccination policy to fit global evolutionary dynamics. • Need to add error to targeting. • Need to vary dispersion of mutation size.