Download
1 / 68
680 likes | 688 Views
GFDL’s IPCC AR5 Coupled Climate Models: CM2G, CM2M, CM2.1, and CM3. Presented by Robert Hallberg But the work was done by many at NOAA/GFDL & Princeton University. GFDL’s IPCC AR5 Coupled Climate Models. New Models. ESM2G and ESM2M. CM2.1/CM3 or CM2M (MOM4.0 & 4.1)

E N D
GFDL’s IPCC AR5 Coupled Climate Models: CM2G, CM2M, CM2.1, and CM3 Presented by Robert Hallberg But the work was done by many atNOAA/GFDL & Princeton University
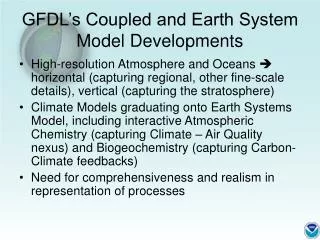
GFDL’s IPCC AR5 Coupled Climate Models New Models ESM2G and ESM2M
CM2.1/CM3 or CM2M (MOM4.0 & 4.1) 1° res. (360x200), on tripolar grid. 50 z- or z*-coordinate vertical levels B-grid discretization Split explicit free surface ; fresh water fluxes as surface B.C. KPP mixed layer with 10 m resolution down to 200 m Full nonlinear equation of state MDPPM tracer advection (CM2M) Tracer diffusion rotated to neutral directions Marginal sea exchanges specified via “cross-land mixing” Lee et al. + Bryan-Lewis background (CM2.1) or Simmons et al. (CM2M) diapycnal diffusion Baroclinicity-dependent GM diffusivity. Anisotropic Laplacian viscosity (CM2.1) or Biharmonic Smagorinsky + Resolution scaled Laplacian viscosity (CM2M) KPP specification of interior shear-Richardson number dependent mixing 2 hour baroclinic and coupling timesteps. Partial cell topography CM2G (GOLD) 1° res. (360x210), on tripolar grid. 59 Isopycnal interior layers + 4 in ML C-grid discretization Split explicit free surface ; fresh water fluxes as surface B.C. 2-layer refined bulk mixed layer with 2 buffer layers Full nonlinear equation of state except for coordinate definition Tracer diffusion rotated to s2 surfaces Partially open faces allow explicit exchanges with marginal seas. Simmons et al. background diapycnal diffusion Visbeck variable thickness diffusivity. Biharmonic Smagorinsky + Resolution scaled Laplacian viscosity. Jackson et al (2008) shear-Richardson number dependent mixing. 1 hour baroclinic timestep, 2 hour tracer & coupling timesteps Continuously variable topography Ocean Components of GFDL Coupled Climate Models
100-Year Annual Mean SST Errors CM2.1 1.17°C RMS CM2G 1.18°C RMS CM2M 1.02°C RMS CM3 1.01°C RMS
100-Year Annual Mean SSS Errors CM2.1 0.87 PSU RMS CM2G 0.93 PSU RMS CM2M 1.05 PSU RMS CM3 0.89 PSU RMS
Global Mean Temperature Bias & RMS Errors, ~190 Years CM2M CM2.1 CM2G (GOLD) CM2G (GOLD) CM3 CM3 CM2M CM2.1
Temperature Anomalies at 1000 m after 190 Years CM2G CM2.1 CM2M CM3
Vertically Integrated Salinity Bias CM2G CM2.1 90 Yrs 190 Yrs
Temperature Anomalies at 4000 m after 190 Years CM2G CM2.1 Climatology CM2M
Pacific Temperature Anomalies after 190 Years CM2G CM2.1 CM2M CM3
Atlantic Temperature Anomalies after 190 Years CM2G CM2.1 CM2M CM3
Atlantic Salinity Anomalies after 190 Years CM2G CM2.1 CM2M CM3
AMOC Strength in 1990 Control Runs 32 Sv 12 Sv Year 0 Year 600
Atlantic Salinities and Overturning Streamfunction CM2G CM2.1 CM2M CM3
Denmark Strait Topography in CM2.1 and CM2G • An excessively deep Denmark Strait sill is ubiquitous in IPCC/AR4 models. • In CM2G the Denmark Strait and Faroe Bank Channel sill depths in CM2G are set to agree with observed, although the channels are too wide. CM2G CM2.1/CM2M/CM3 3.5 Sv 9 Sv
Changes after 110 Years in 1% per year CO2 Runs CM2G CM2.1 Atlantic Temperature Change & Overturning Streamfunction SST Change
Summary GFDL will be using 3 new coupled climate models for IPCC AR5 (CM2G, CM2M, and CM3) plus CM2.1 from AR4. • CM2.1, CM2M & CM2G have similar time-mean SST biases; Replacing the atmosphere in CM3 improved several of these. • CM2.1, CM2M & CM3 have similar interior ocean bias patterns, but with different magnitudes (the largest biases are in CM3). • CM2G has clearly superior thermocline structure & watermass properties, and AMOC structure, and very different abyssal biases. • These differences seem to be mostly due to the inherent nature of the isopycnal vertical coordinate, compared with a geopotential coordinate • Some interior ocean basin scale temperature biases can be directly related to surface fresh water forcing biases. Do any of these differences matter for climate change projections?
100-Year Mean February SST Errors RMS February SST Errors: • CM2G 1.46°C • CM2.1 1.84°C • CM2M 2.00°C CM2.1 CM2G Reynolds Climatology
100-Year Mean February Depth to SST - 1°C CM2.1 CM2G WOA2001 Climatology
100-Year Mean Sea Surface Salinity CM2.1 CM2G
CM2G CM2.1 100-Year Mean Sea Ice Concentration March March September September
The RMS Annual-Mean SST Error With 1990 Forcing, there is committed warming.
CM2G CM2.1 Long-term Evolution of Annual Mean SST Errors Year 101-200 1.17°C RMS Year 101-200 1.18°C RMS Year 301-400 1.47°C RMS Year 361-380 1.27°C RMS
CM2G CM2.1 Pacific Ocean Temperatures, ~190 Years Zonal Mean Pacific Ocean Potential Temperatures Average of Years 181-200 Climatology
CM2G CM2.1 Pacific Temperature Bias, ~190 Years Possible causes of biases: CM2.1: Excessive diffusion Overly entraining overflows. Weak abyssal flow. CM2G: Insufficient diffusion. Overly wide abyssal cateracts Climatology
CM2G63L CM2.1 Pacific Salinity Bias, ~190 Years Zonal Mean Pacific Ocean Salinities Average of Years 181-200 Climatology
ENSO Spectra for CM2M and CM2G CM2M NINO3.4 Spectrum CM2G NINO3.4 Spectrum
CM2G CM2.1 Atlantic Temperature Bias, ~90 Years Zonal Mean Atlantic Ocean Potential Temperatures Average of Years 81-100 Excludes most marginal seas Climatology
CM2G CM2.1 Atlantic Temperature Bias, ~190 Years Possible causes of Atlantic bias: • Committed warming from 1990 forcing • Circulation errors • Excessive vertical diffusion • Excessive exchange with Mediterranean • Errors in NADW formation • Salty bias from runoff + precip. - evap. Climatology
CM2G CM2.1 Atlantic Temperature Bias, ~290 Years Possible causes of Atlantic bias: • Committed warming from 1990 forcing • Circulation errors • Excessive vertical diffusion • Excessive exchange with Mediterranean • Errors in NADW formation • Salty bias from runoff + precip. - evap. Climatology
CM2G CM2.1 Atlantic Salinity Anomalies, ~190 Years Zonal Mean Atlantic Ocean Salinity Average of Years 181-200 Excludes most marginal seas Climatology
CM2G CM2.1 Atlantic Ocean Temperatures, ~190 Years Zonal Mean Atlantic Ocean Potential Temperatures Average of Years 181-200 Excludes most marginal seas Climatology
CM2G CM2.1 Atlantic Salinities, ~190 Years Zonal Mean Atlantic Ocean Salinity Average of Years 181-200 Excludes most marginal seas Climatology