Download
1 / 1
10 likes | 119 Views
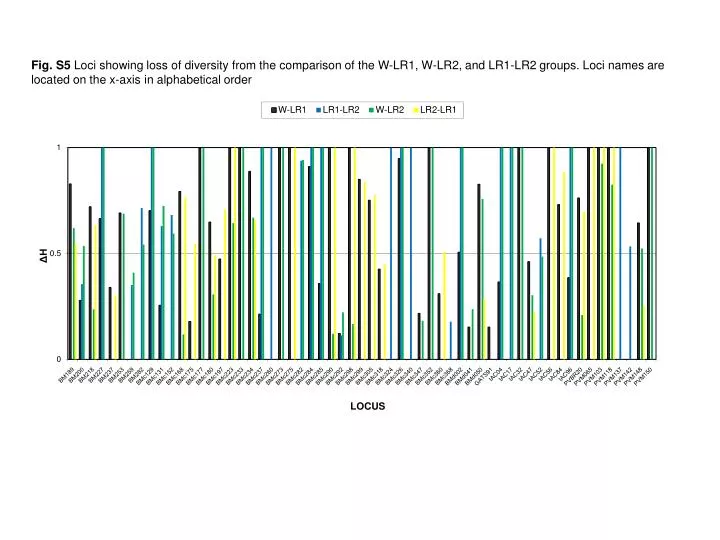
Fig. S5 Loci showing loss of diversity from the comparison of the W-LR1, W-LR2, and LR1-LR2 groups. Loci names are located on the x-axis in alphabetical order.

E N D
Fig. S5 Loci showing loss of diversity from the comparison of the W-LR1, W-LR2, and LR1-LR2 groups. Loci names are located on the x-axis in alphabetical order