Download
1 / 68
690 likes | 886 Views
Systems Thinking Overview. TNT 2008 Sources from The Open University acknowledged. My Background. Fellow of Mech. Engg. & Management 40 years applying systems to business 13 years as independent consultant 25 years tutoring OU systems courses External examiner to Arab OU

E N D
Systems Thinking Overview TNT 2008 Sources from The Open University acknowledged
My Background • Fellow of Mech. Engg. & Management • 40 years applying systems to business • 13 years as independent consultant • 25 years tutoring OU systems courses • External examiner to Arab OU • Lecturer on analytical techniques for MBA • Course can be tailored in time & content
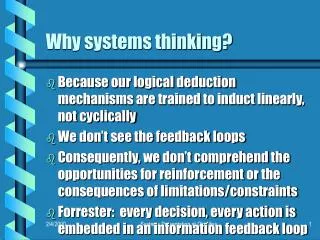
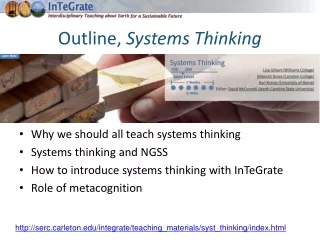
Systems Thinking - Background • Formalised in ’60s by Peter Checkland • Need grew as society became increasingly “interconnected” • Opposite to “reductionism”, breaking things down into components, as most Work Study • Decreases the detail by “going up” to see the whole picture
Systems Thinking - Utility • Holistic view of human systems • Systems that have a purpose • Are complex and interconnected • Results - intended, unintended & emergent properties • Try for them not to be a surprise
Systems Thinking - Principles • Looks from a higher level to sense the issues • Uses many techniques to understand a problem • Adopts analytical management techniques to decide what to do • Embraces advanced management techniques for action and implementation
Systems Thinking – A Toolbox • So the method helps progressively • To sense the context of the problem • To understand the issues • To decide upon options to solve • To act to an agreed plan • Systems Thinking has its own language • Integrates with advanced management concepts
The objective of the course hammered hammer hammerer
Course Aims • Encourage an interest in systems thinking • Develop an awareness of systems • Their properties • Their interconnectedness • Enable student to start to think systemically • Or at least differently, openly • Create confidence to test on real problems
Learning Outcomes • Understand where systems thinking is different • Understand the meaning of systems terms • Be alert to the perspectives of others • Create 6 types of graphic analysis tool • Understand how systems thinking can be useful • Create confidence in using some aspects • Provide links to other management concepts
Course Modules • Module 1 – Intros, Overview, ice breaker • Module 2 – Stakeholder analysis • Module 3 – Sensing & diagrams • Module 4 – Systems maps • Module 5 – Understanding & diagrams • Module 6 – Modelling, Indicators & Deciding • Module 7 – Acting & key management insights • Module 8 – Reporting, wrap up, feedback
System • Connected components which do something • Systems must have an intended Purpose • May have emergent properties – not designed, but desirable • Or unintended consequences – not designed, but undesirable • They have a hierarchy • Levels • Sub-systems • Environment
Setting a Boundary (Purpose) • Deciding a Boundary is key • Defines or isolates what is practical to consider • Determines focus of study • Determines the Environment, • So Limits and Defines the Study • inputs to the Terms of Reference
Holistic • Systematic or Reductionist • Perfect for many problems • Step after step towards the solution • The “traditional” approach of engineers • Systems Thinking is about analysing complex problems in a holistic manner • Systemic, the total system • Look at all the issues and their implications • There will be many Inter-connections & Complexity
Stakeholders & Perspectives • We recognise that we are not all the same • We attempt to maximise the consensus • Care can usually create an optimum solution • Stakeholders, no definition needed here • Analysis can often be quite simple yet powerful as a 2x2 matrix
Boston Market Matrix KEY S = Security F = Food MD = Medical devices P = Pharma C = Cosmetics H = Hospitals PH = HPA W = Water Easier PH W S MD P Ease of sale F H C Harder Lower Higher Risk to Reputation
Modelling & Indicators • Modelling performance of system/systems • Examples • Economies • Spread of infection • Insurance risks • Deciding on “true” indicators • Partial indicators • The change in value of Key Indicators
The SUDA Methodology • There are many methodologies • This is one, sensible disciplined approach • Sensing the problem • Understanding the issues • Deciding on the options for action • Acting – taking action
Link to Diagramming • Each type has an optimum use • Sort out your own ideas – Sensing • Suggest possible causes - Understanding • Suggest points of interest - Understanding • Determine impacts of actions - Deciding • Explain actions which may help – Acting
Diagramming A key part of understanding & Communicating to the Steering Group
Diagramming • The common types • Spray Diagram • Rich Picture • Systems Map • Influence Diagram • Multiple Cause Diagram • Sign Graph • Control Diagram
Why use Diagrams • As an aid to study and note taking • Spray diagram • Convince others with emotion Rich Picture • with facts all the rest • Analyse how it works • Many diagram types • Convey information – facts & stimulate ideas • Fortunately T214 only uses 5 types • A picture is worth a 1,000 words
Factors to Consider • Purpose of the diagram • to aid your own thinking • to inform or convince others • Assess the Influence or Effects of the factors involved • Estimate the effects of key factors
Diagrams used for Sensing • Sensing the problem • Spray diagram • Rich picture • Systems map (this can also be used in the understanding phase to determine the structure of problems)
Spray Diagram • Excellent for note taking • Use one per topic in initial studies • Then look for common themes • Re-draw showing connections to central topic • Not just a list, should convey some key relationships and the relative interests of stakeholders
Spray Diagram • Similar to diagrams known as “Mind Maps” • Excellent for note taking • Use one per article/book when studying • Then look for common themes between the sample • Re-draw showing connections to central topic • Not just a list, should convey some key relationships and relative interests of key stakeholders or issues
Spray Diagram of The Institution Assessment Process Regions ILOs BFIM R. Managers Staff Member Recruitment Events Member Services Promotion Proceedings The Institution Fees Admin Publications Non-members PE Public Perception Influence Press Public Government Competing Institutions Marketing & PR Fig. 1
Spray Diagram Exercise • Consider examples passing around, mainly from students • Think of the topic “My Journey to this Tutorial” • Individually write a list of the stakeholders involved Now draw a Spray Diagram in groups
Rich Picture • Requires a little more feel for the topic • Does require an element of artistic talent • Do not get round this by excessive clip-art • Can convey emotion like art or photos • You know good RPs when you see them • They usually show a linking thread of ideas • Road from small (closed) shops to busy supermarkets • Pollution in river from industry to leisure areas • Studying at home with problems & distractions
Rich Picture • A little more knowledge of the topic • Does require some artistic talent • Can convey emotion like good art or photos • You know good ones when you see them • They usually show a linking thread of ideas • Road from small (closed) shops to supermarkets • Pollution in river from industry outflow to fishermen • Studying at home with problems & distractions
Rich Picture Exercise • Consider examples passing around, mainly from students • Consider all the SDs of “My Journey to this Tutorial” Now draw a Rich Picture in groups
Systems Map • Show relationship between systems and components of systems • Must have a named boundary • may need to experiment with the boundary • Want to see levels • Some overlapping is acceptable • Each sub-system must be named • We have mentioned where conventions matter
Systems Map Exercise • Consider examples passing around, mainly from students • Think of the topic “Where I Live” • Individually write a list of the entities involved Now draw a Systems Map in groups
Systems Map of The Institution The Institution Governance Disc. TB M Recruit C Learned Soc QMB TSB Outsource Co Audit Regions LASC Events Divns Admin IT WP Finance FM TACs Grps Cater Room Book Development Public Services M Services MB CPD Pubs Lib BF Bks PE BC ILOs Proc Govt.Register Fig. 2
Example Problems • The “practitioner” course allows groups to work on current topical examples • They witness varying perspectives • The observe new insights
Diagrams for Understanding • Understanding the problem • Systems map • Influence diagram • Multiple cause diagram • Sign graph • Modelling techniques and flow diagrams
Influence Diagram on Potential Members Local Events Members National Events Government Service National Press Prestige Profit Qualified Non Members PR Public Fig. 3
MC Diagram of Delivery Centres (23) TACs (c.30) National Local Local Events No.1 Room Regions (16) Grps/WPs (c.15) National Events Other Room Branches Areas Panels Local Room Members Served Electronic Poss. Profit Small Costs More No.1 Rm Hire Non-members Served ? Fig. 4
Techniques for Deciding • Sign Graphs or Control Diagrams • Multiple Criteria analysis (MCA) • Strength Weakness Opportunity & Threat (SWOT) • Social, Technical, Economic & Political (STEP) • 4 Ws & an H What, How, Why, When & Where? • Modelling
Modelling • Selection of techniques • Spreadsheets • Pre-formatted • “Self built” • Prediction of changed performance • Essential to decide/agree indicators • Qualitative • Quantitative
Frequently Referenced Authors • Handy 4 cultures • Hofstede’s culture categories • Bates pathologies • Pfeffer • Sterner and many others
Frequently Referenced Concepts • Top down, bottom up • Emergent & Managed Change • Problem Articulating Skills • Simplifying Strategies • Selective attention, Assuming continuity over time, Local focus, Typifying, Averaging • Colonisation, Collaboration • Interpenetration, boundary people, interlocking elites
Comment on Modules • Modules 1 – 6 can be expanded to 2 days • Client specific project preparation can be added to a third day • Arab OU tutor training of 18 hours of material • A more in depth follow-up is possible
Course Delivery • This course is tailored in time & content • Objective: • Management overview 2 - 4 hours • Practitioner team 2 – 3 days • An OU qualification 2 – 3 years • Group size 4 - 12
Course Deliveries • Many years to OU students – 16 hours pa • Arab OU tutors – 24 hours • Various commercial clients
Influence Diagram • A influences B, not B certainly follows A • Not a flow diagram • Can map onto a Systems Map, but go to individual entities not (sub) systems • Should show • a boundary although you can start without one • arrows show the direction of influence • have a key to the strength of influence • When analysing them it is usually best to focus on concentrations of influences
Influence Diagram - Hints • Basically Systems Maps with lines of influence added • Like SMs, snapshots of the system of interest • Use to highlight key influences between components • Be selective - show important influences only • Use space and relative distance to indicate nature of relationship • Arrows are used to indicate direction of influence • Never double headed arrows - use two arrows • Nearly always arrows of influence from one entity to another • Use arrows of different thickness to denote different strengths of influence • Provide a key • Keep crossed lines to a minimum - redraw to avoid
Drawing a ID • Start with topic of key interest in centre of space • Add the major relevant influences • Add the “next layer” of contributory causes and their links • Aim for between 7 and 15 “entities” • Revise and iterate, but keep your discarded versions • Experiment with the appropriate Boundary • Review the purpose • It is a part of the ART of communication • avoid too many lines crossing • correct level of detail for the purpose