Download
1 / 21
210 likes | 338 Views
Mobility Scooter Use and the Physical Functioning of Older Adults. Roselle Thoreau University College London (UCL) United Kingdom. Some of the main benefits of being physically active are: Maintain better health Stay more mobile for longer Live longer Maintain independence. Walking.

E N D
Mobility Scooter Use and the Physical Functioning of Older Adults Roselle Thoreau University College London (UCL) United Kingdom
Some of the main benefits of being physically active are: • Maintain better health • Stay more mobile for longer • Live longer • Maintain independence
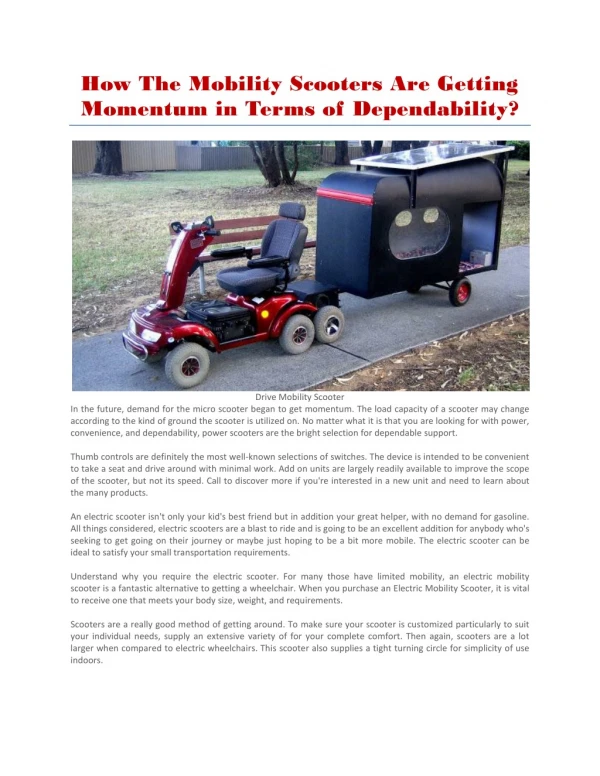
Walking • The most common form of physical activity adults over 65 partake in. • A brisk walking pace is linked to a reduced risk of premature death BUT only 16% of adults over 65 regularly walk at this pace. • When walking becomes more difficult people turn to
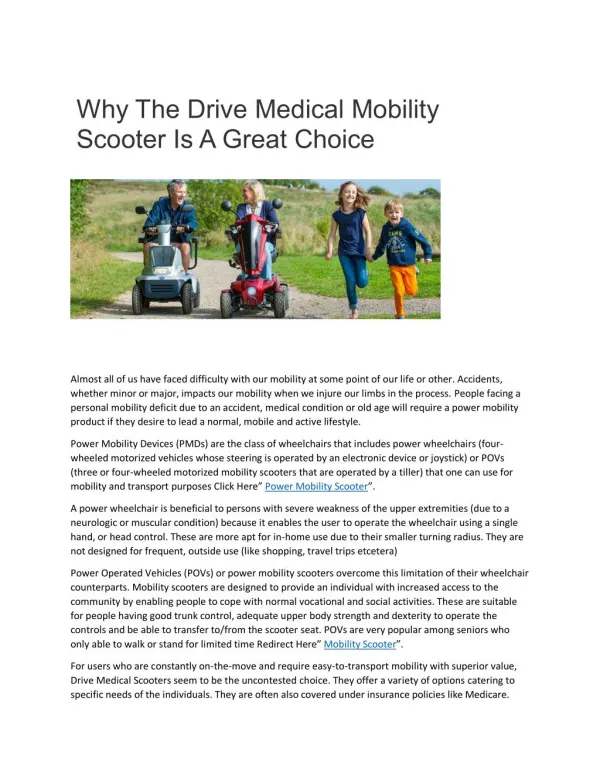
Mobility Aids • Canes • Walking frames • Mobility Scooters
How do the health and capabilities of people who use different mobility aids (or are unaided) differ? Is the rate of decline between these groups different over time?
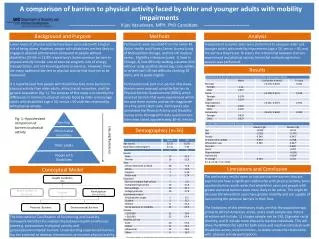
English Longitudinal Study of Ageing (ELSA) • Multi-stage stratified random sample • 2002 – 2009: Waves 1 – 4 • Participants are 50+ in 2002. Our sample • 65yrs + (Wave 1) • Divided into Scooter users Cane users No mobility device users
Wave 1 - 2002 • Scooter use is low – 1.4% • The average age of scooter users is 76 • Scooters are not used in isolation • 78% also used a cane • 17% also used a walker
Changes over time: Chair rises Between the two tests (4 years) scooter users become significantly slower over time when compared to the other groups
Percentage in each user group able to complete tests during each wave
Percentage of users able to complete tests • Scooter users are less likely to complete the test
Changes over time: Grip Strength Dominant and Non-Dominant Hands Scooter users lose more grip strength over time than any other groups in both hands
Changes over time: BMI • In Wave 2: there are no significant differences in BMI between scooter users and other groups • In Wave 4: there is a significant difference in the BMI of non aided and scooter users and cane users
Conclusion • All capabilities lessen over time • Scooter users lose the most • Scooters users have the highest rates of inability to complete (in single waves and over time) Scooter use may accelerate frailty, mobility difficulties and further disability
Mobility Scooters replace walking THAT IS THEIR PURPOSE BUT Potential users should be made aware of both the negative and the positive effects of using scooters before they make a decision to use
Further Research • Measuring new scooter users against unaided counterparts with similar capabilities • Understand the behavioral reasons for scooter uptake • Examining the types and mode of journeys made pre and post scooter uptake
Thank you for listening Roselle Thoreau Dept for Civil, Environmental and Geomatic Engineering University College London (UCL) London, England • r.thoreau@ucl.ac.uk
References • Bohannon, R.W., Bear-Lehman, J., Desrosiers, J., Massy-Westropp, N. And Mathiowetz, V (2007) Average Grip Strength: A meta-analysis of data obtained with a Jamar dynamometer from individuals 75 years or more of age. Journal of Geriatric Physical Therapy, 30(1) • Department of Health. (2002). Health Survey for England 2000: The health of older people. www.dh.gov.uk/en/Publicationsandstatistics/Publications/PublicationsStatistics/DH_4008793