Download
1 / 27
270 likes | 453 Views
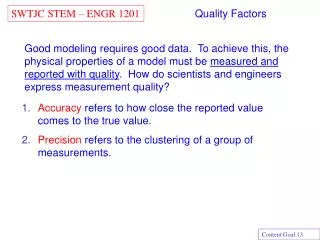
Menu – Number of items; extent to which many and/or complex items must be produced. Food Preparation Methods – Extent to which convenience foods are used. Desired Service Levels – Consider, for example, counter service and table side preparation or service.

E N D
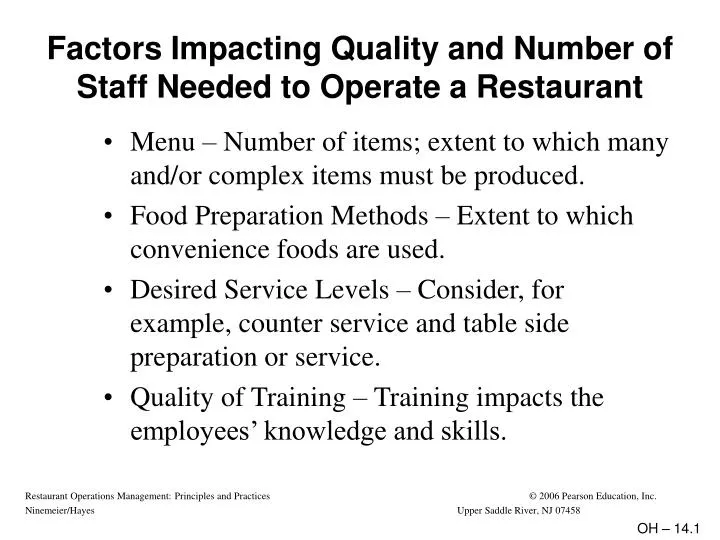
Menu – Number of items; extent to which many and/or complex items must be produced. Food Preparation Methods – Extent to which convenience foods are used. Desired Service Levels – Consider, for example, counter service and table side preparation or service. Quality of Training – Training impacts the employees’ knowledge and skills. Factors Impacting Quality and Number of Staff Needed to Operate a Restaurant OH – 14.1
Select Productivity Measures Forecast Guests and/or Revenues and Staffing Needs Schedule Staff Evaluate Labor Control Results Four-Step Labor Cost Control System Step 1: Step 2: Step 3: Step 4: OH – 14.2
Labor Cost Percentage Cost of Labor = Labor Cost % Revenue What is “cost of labor?” It includes: • Salaries/wages (payroll) • Social Security taxes • Unemployment/workers’ compensation taxes • Employee health, dental, vision insurance premiums paid by the employer • Vacation/sick leave/personal days • Employee meals • Employee training expenses OH – 14.3
Calculation of Lunch and Dinner Labor Cost Percentages OH – 14.4
When Using a Labor Cost Percentage: • Consistently use the same types of labor cost information when computing and comparing the labor cost percentage • Realize that labor cost percentages are affected by changes in wage rates • Recognize that labor cost percentages are affected by changes in menu selling prices and in total revenues generated OH – 14.5
Revenue Per Labor Hour Total Revenue Labor Hours Used Note that: • Operations with different wage rates can still have the same revenue per labor hour • The productivity measurement is easy to compute • The ratio can be used to schedule employees if revenue estimates and historic revenue per labor hour data is available OH – 14.6
Labor Dollars Per Guest • This measure is easy to calculate • It effectively measures productivity when the number of guests stays relatively constant Total Labor Dollars Total Guests Served OH – 14.7
Guests Served Per Labor Hour • Cost of labor • Changes in menu selling prices • Total revenue dollars generated Number of Guests Served Number of Labor Hours Used Note: This measurement is not affected by OH – 14.8
Guests Served Per Labor Hour:Example by Functional Area OH – 14.9
Productivity Measurement Comparison OH – 14.10
Historical Data for Forecasting Future Revenue • Prior day’s sales • Average sales for the prior four same days (for example, Sundays or Tuesdays) • Prior week’s average daily sales • Prior month’s average daily sales • Actual sales on the same day (prior year) • Average actual sales on the same day (prior two or more years) • Average actual daily sales in the same month (one or more prior years) OH – 14.11
LaToya’s Restaurant: Weekly Revenue Forecast Note: Assume a 30% labor cost for food revenue and a 25% labor cost for beverage revenue: $36,850 x .30 = $11,055 labor to generate revenues $13,150 x .25 = $3,287.50 to generate beverage revenues OH – 14.12
Factors to Consider Before an Employee Schedule Is Developed • Labor costs do not maintain a fixed relationship to revenue. Labor cost percentages decrease as revenues increase and increase as revenues decrease because salaried labor is spread over a larger (or smaller) revenue base. • Up to a point, no additional employees are needed as revenue levels increase (consider the possible need for only one receptionist in a dining room with a capacity of 50 guests). • The need for fixed and variable labor employees should be forecast separately. OH – 14.13
An Effective Employee Schedule Impacts: • The quality of products and services provided to guests • The employees’ level of job satisfaction • The restaurant’s profitability • The perception that the manager’s own boss has of his/her ability to manage effectively OH – 14.14
Basic Information for an Employee Schedule • The dates covered by the schedule • The day of the week covered by the schedule • Employee first and last names • Scheduled days to work • Scheduled days off • Scheduled start time (designate A.M/ P.M.) • Scheduled stop time (designate A.M/ P.M.) OH – 14.15
Still More Information for an Employee Schedule • Total schedule period hours to be worked (exclude scheduled meal periods from totals) • Requested vacation or personal days off • On/Off days for salaried personnel • The date the schedule was prepared • The individual who has prepared/approved the schedule OH – 14.16
Employee Scheduling Principles OH – 14.17
Possible Reasons to Modify Employee Schedule • Significant increases/decreases in forecasted business volumes • Unanticipated voluntary and involuntary employee separations • Employee call-ins or no-shows • Unanticipated changes in operating hours or work assignments OH – 14.18
Calculation of Negative Labor Cost Variance • Dollar Variance: $20,000 actual cost (-) $15,000 targeted costs = $5,000 negative variance • Percent Variance: 40% actual labor cost % (-) 30% targeted labor cost % = 10 percent negative variance LaToya forecasts $50,000 in revenue with a target of a 30% labor cost: $15,000 ($50,000 x .30 = $15,000). She has generated $50,000 in revenue but spent $20,000 on labor ($20,000 ÷ $50,000 = 40 % labor cost). OH – 14.19
Calculation of Positive Labor Cost Variance • Dollar Variance: $15,000 targeted cost - $13,000 actual cost = $2,000 positive variance • Percent Variance: Planned cost: $15,000 labor cost = 30% targeted labor cost % $50,000 revenue Actual cost: $13,000 labor cost = 26% actual labor cost $50,000 revenue (30% - 26% = 4% positive variance) Another manager anticipates $50,000 in revenue and a $15,000 labor cost. The revenue goal is attained, but actual labor costs are only $13,000. OH – 14.20
Estimated Total Payroll Cost Per Shift (Meal Period) OH – 14.21
Outcome Summary Chart Review each of the four outcomes below. Pay attention to the future strategies which apply to the outcome which best represents your operation. Outcome 1 Goals Met? Financial Goals Met Yes Service Goals Met Yes Future Strategy: Congratulations! Continue to monitor your results. Celebrate your success with staff members to let them know how well they are doing. Outcome 2 Goals Met? Financial Goals Met Yes Service Goals Met No Future Strategy: Don’t allow service levels to suffer even though you are meeting your financial goals. Review your staffing patterns to identify “under-staffed” time periods that caused poor service levels. Review your service-related training procedures for weaknesses. Outcome 3 Goals Met? Financial Goals Met No Service Goals Met Yes Future Strategy: Overstaffing may ensure that you meet your service goals, but the continued economic viability of the operation is also critical. Study your schedule for areas of overstaffing. Ask your employees for ideas about how to better serve guests. Start now! Outcome 4 Goals Met? Financial Goals Met No Service Goals Met No Future Strategy: You are not alone. Many managers find themselves in this position when they take over a new or existing operation and/or when financial and/ or service goals are increased. Don’t panic. Build employee schedules that meet your targeted financial goals, and then observe staff carefully to identify service bottlenecks. Intensify your training efforts to help employees meet their service-related goals. Monitor your improvements! OH – 14.22
Is an Employee Salaried? • The employee’s primary duties (at least 60% of the time) must involve managing the business or a department within it. • The employee must regularly direct the work of two or more other employees. • The employee must have the authority to hire, fire or recommend courses of action. OH – 14.23
Technology and the Enhancement of Management Productivity • Record Keeping • Scheduling • Training • Report Generation OH – 14.24
Technology and Back-of-House Activities • Evaluating vendor supply specifications online • Scheduling deliveries and placing orders • Performing nutrition-related analysis of menu items • Creating production schedules based on forecasted revenue and/or guests • Developing storage requisition (issue) lists • Computing and comparing actual ideal food costs • Maintaining inventory records and extending inventory accounts and values OH – 14.25
Technology and Front-of-House Activities • Helping to monitor individual server and cashier banks • Simplifying and displaying table assignments • Allowing servers to separate guest checks at any time in the guest order process • Sending orders to the kitchen by use of wired or wireless technology • Starting orders by touching a picture of the table or by entering table number • Allowing for daily (or more frequent) changes of menu special prices • Simplifying debit or credit card processing at the POS station OH – 14.26
Technology and Bartenders’ Activities • Identify cash, credit and house account patrons • Track contribution margins of items sold • Manage (track) beverage products and supplies and generate purchase orders • Evaluate revenue and labor hours expended • Monitor product usage for actual and targeted pour percentages • Record product transfers to and from the kitchen • Schedule beverage employees based on forecasted revenue levels • Create and print wine lists and other beverage specials menus • Maintain drink recipe files OH – 14.27