Download
1 / 6
60 likes | 175 Views
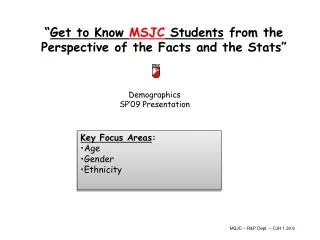
Demographics SP’09 Presentation. Key Focus Areas : Age Gender Ethnicity. “ Get to Know MSJC Students from the Perspective of the Facts and the Stats”. MSJC – R&P Dept. – CJH 1.30.9. MSJC - Age of Students By Academic Year.

E N D
DemographicsSP’09 Presentation • Key Focus Areas: • Age • Gender • Ethnicity “Get to Know MSJC Students from the Perspective of the Facts and the Stats” MSJC – R&P Dept. – CJH 1.30.9
MSJC - Age of StudentsBy Academic Year MSJC students are getting younger…approximately 57% of all students are under 25 years of age. Source: CCCCO Data Mart 1.30.9
MSJC - Age of StudentsRelative to StatewideAY 2007-’08 A larger percent of MSJC students (57%) are under age 25 relative to the statewide percentage (51%). Source: CCCCO-Data Mart 1.30.9
Females account for 6 out of 10 MSJC students (61%) … statewide females make up 54% of CCC student population Gender of StudentsAY 2007-’08 Source: CCCCO-Data Mart 1.30.9
MSJC is underrepresented in share of Hispanics relative to Riverside Co. and slightly below CCC Statewide average MSJC - Student Ethnicity 2007-08Relative to Riverside County & CCC Statewide – AY2006-’07 Source: CCCCO-Data Mart 8/8/8 MSJC & CCC Statewide AY2006-’07 / *U.S. Census Bureau - Riverside Co. and CA. 2006 est.; MSJC R&P Dept. XCJH 1.30.9
The Hispanic population on MSJC has increased significantly (approximately 6 percentage points) in the past five years from 24% to 28.9% for the academic year ending 2007-08. The Asian/Filipino population increased approximately 3 pts. to 6.9% Black population has increased 2 pts. To 7.2% MSJC - Student Ethnicity By Academic Year SP Demo-1 Source: CCCCO-Data Mart 3/21/08