Download
1 / 38
380 likes | 541 Views
Explorations of multi-level methods & ecological inference techniques in the analysis of “Life Courses in Context”. Peter Doorn & Luuk Schreven peter.doorn@dansdata.nl & luuk.schreven@niwi.knaw.nl Data Archiving & Networked Services (DANS)

E N D
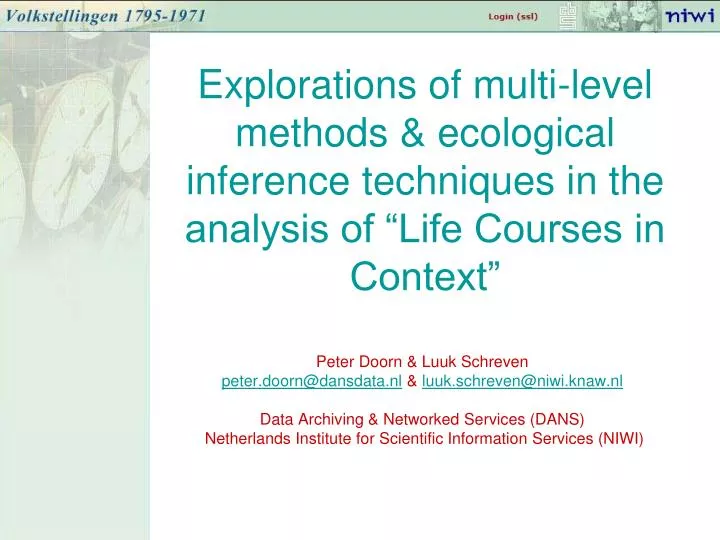
Explorations of multi-level methods & ecological inference techniques in the analysis of “Life Courses in Context” Peter Doorn & Luuk Schreven peter.doorn@dansdata.nl & luuk.schreven@niwi.knaw.nl Data Archiving & Networked Services (DANS) Netherlands Institute for Scientific Information Services (NIWI)
Structure of presentation • Introduction to “Life Courses in Context”-project • Life Courses: Historical Sample of the Netherlands (HSN) • Context: Census digitization project • Exploration of multi-level methods & ecological inference techniques
Introduction to Life Courses in Context project Two separate components: • Life Courses: Historical Sample of the Netherlands (HSN) • Context: Digitization of (aggregate) Census data 1795 – 1971 One combined grant application to Netherlands Organisation for Scientific Research (+ € 3.6 mln funding)
Aim of Life Courses in Context project ‘…to develop a collaboratory for the study of 19th and 20th century population history.’ By combining the HSN and Census data sources: • HSN: Micro data + 40,000 individual life courses • Census: aggregate data from published census tables
Life Courses: Historical Sample of the Netherlands ‘…to construct life courses as completely as possible for a representative portion of the 19th and 20th century population in the Netherlands.’ A sample has been drawn from the birth registers of all persons born in the Netherlands between 1812 and 1922 (sample size = 77,000 persons) Data gathering by International Institute of Social History (IISH-IISG) since 1991
Sources of HSN • (already mentioned) Birth registers basis of sample Person born, names, addresses, ages and occupations of parents (literacy of father) • Death certificates Place of residence, age and occupation of deceased, information on his/her spouse. In case of child occupation and literacy of father • Marriage certificates Occupations, place of residence and literacy of couple, parents and witnesses • Dynamic population registration system (in use since 1850) & personal record cards (later stage) Family structure, pattern of migration • Land registers & tax records (later stage) Occupational history and wealth of subject
Use of HSN • Basic resource for historical research in demography, sociology, epidemiology, socio-economics and social geography • Control database to compare research data • Foundation for the collection of new data • Source of expertise on data collecting Questions? Contact Kees Mandemakers (KMA@iisg.nl)
Context: Census Digitization 1795-1971 • ‘…to digitize all published (aggregate) census data from Dutch population, housing and occupational censuses between 1795 to 1971’ • National population censuses are one of the fundamental sources of information on conditions in a country, used in historical and social science research • Information on population size and structural characteristics: age, gender, marital status, religion, household status, occupational activity and nationality
Main objectives of Dutch censuses • To determine the size of the population on a fixed point in time • To probe and improve the reliability of the Dutch population registers • To examine the demographic and social-economic characteristics of the population • To provide data to facilitate domestic policy making
Census Digitization projects: 1997 – present • 1997 - 1999: • Scanning 200 books, 42.500 pages • Data-entry census 1899 • 2002 - March 2004: • Validation and correction of census data 1795-1859 and 1930 • Digital archiving census 1960 and 1971 • March 2003 – December 2005: • Life Courses in Context (see: http://www.lifecoursesincontext.nl) • Data-entry of census data 1869-1956 • Documentation, harmonization, access and research
What has been realized? • New website up and running • Only in Dutch! • Some 40,000 pages of tabular (aggregate) census data downloadable from website • Documentation is available • Validation and correction are partially complete • Harmonization schemes for certain census variables • (restricted) Access to original micro data files for 1960 and 1971 census • Van Tubergen & Maas (2005)
Still to do… • Finishing validation and correction • Building harmonization schemes for census variables: • HISCO for harmonization of occupations • Standardizing sub municipal divisions • Harmonizing other variables and categories • Better access to the data • Data not only as Excel spreadsheets • StatLine or Nesstar? Or other publication tool? • Translation of the website to English!
Combining HSN & Census datasets • Census covers whole population; check on data collected in sample • Data sets are complementary; more data will be available • HSN data are longitudinal; census data are cross-sectional snapshots • Census data provide more regional detail • Combining data can result in identification of individuals (privacy issues!)
Combining data across levels of aggregation Historians have rarely tried to combine data from sources of unequal levels of aggregation Three approaches to combine data from the HSN and Censuses: • Aggregating individual data • Multi-level or cross level analysis • Disaggregating aggregate data
Aggregating individual data • Most straightforward way of combining two sources • Details of the individual will be lost • Aggregating HSN data for cross-sections at census years is no easy task • Censuses are not perfect; statistical deviations found can either be caused by HSN or by census
Multi-level analysis • No actual linkage of records; in multi-level analysis the objective is to statistically explain a phenomenon in which higher levels of scale are included in the analysis • Censuses provide background variables not available in HSN; whereas HSN contains individual detail not found in census tables • In analyses at the individual level, ecological effects of higher levels may be taken in consideration
Reconstruction of individual records from aggregate tables • Statistical Disclosure Control & synthetic estimation methods • Prevent identification of individual entities from aggregate data • Synthetic estimation methods can be used to reconstruct synthetic individual records from detailed census tables • Ecological inference • ‘…is the process of extracting clues about individual behaviour from information reported at the group or aggregate level’ • Difficult technique, it remains a challenge to apply it to the Dutch censuses Questions? Contact Peter Doorn (peter.doorn@dansdata.nl)
Conclusion and directions for future research This paper makes a plea for more interest by historians for the linkage of data from different levels of aggregation The next step is to elaborate on the approaches described in this paper empirically Data and techniques are available, we need a researcher who wants to take on the challenge
Contact Information • dr. Peter Doorn Director Data Archiving & Networked Services www.dans.knaw.nl peter.doorn@dansdata.nl • drs. Luuk Schreven project coordinator Census digitization www.volkstelling.nl luuk.schreven@niwi.knaw.nl Paper available in electronic form from website www.lifecoursesincontext.nl
Population per municipality in 1795 In 1795 Amsterdam is the biggest city with 217.024 “souls” Klein-Waspik is the smallest hamlet with 3 inhabitants; a total of 1807 municipalities are mentioned in the census. Source: http://www.nidi.nl/
Boonstra’s NLKaart • Dr. Boonstra’s NLKaart; • mid 1980’s onwards • first Historical GIS? • municipal boundaries between 1830 - 1990 • first SAS/Graph based, later MapInfo
HGIN; a Historical Geographic Information System for the Netherlands • Project goals: • Converting and correcting Boonstra’s NLKaart • digitizing maps with sub municipal boundaries ‘wijken’ (neighbourhoods) and ‘buurten’ (blocks) (1920 – 1971) • Setting up a gazetteer of historic places • Making the everything available on the web
HGIN details: technical stuff • Scalable Vector Graphics • Geoserver as basic geographical data server (OpenGIS) • User friendly interface in NIWI’s Content Management Software: i-Tor see: http://www.itor.org or http://www.nidi.nl for working preview of the GIS.
HGIN details: results so far • Testversion of mapping application is running at NIDI’s website (www.nidi.nl) • 1960 and 1971 sub municipal maps available • 1930, 1947 and 1956 maps are being digitized (outsourced) • NLKaart converted to ArcGIS • Work on gazetteer started
HGIN details: religion 1971 (provincial) Percentage Roman Catholic by province, Census 1971
HGIN details: religion 1971 (municipal) Percentage Roman Catholic by municipality, Census 1971
HGIN details: religion 1971 (submunicipal) Percentage Roman Catholic by block / neighbourhood, Census 1971