Download
1 / 162
1.62k likes | 1.79k Views
Recent study sought to monitor pattern of HRT use from 1993 to July 2003. From 1993 to 1999, annual prescriptions rates rose from 58 to 90 million and remained steady until June 2002. However, from July 2002 until July 2003- after the publication of HERS, HERS II and WHI-

E N D
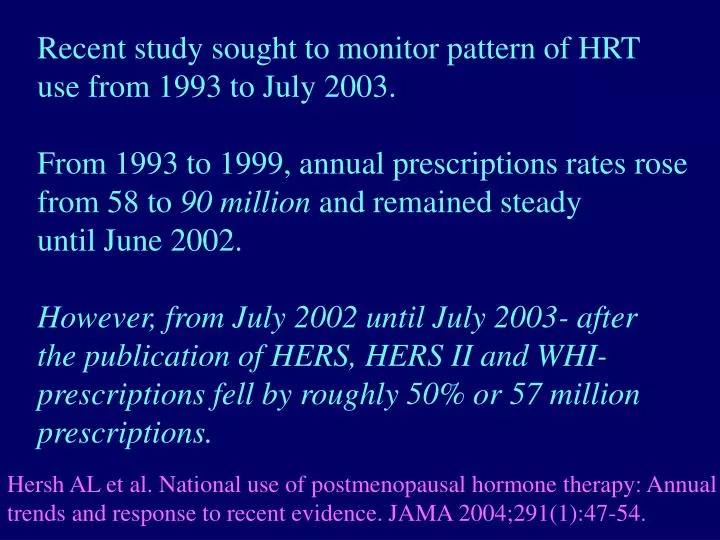
Recent study sought to monitor pattern of HRT use from 1993 to July 2003. From 1993 to 1999, annual prescriptions rates rose from 58 to 90 million and remained steady until June 2002. However, from July 2002 until July 2003- after the publication of HERS, HERS II and WHI- prescriptions fell by roughly 50% or 57 million prescriptions. Hersh AL et al. National use of postmenopausal hormone therapy: Annual trends and response to recent evidence. JAMA 2004;291(1):47-54.
Care of the Chronic and Terminally Ill Patient. • COLDs • Affects 15 million Americans • 5th leading cause of death • Epidemiological evidence indicates that • incidence of COLDs has risen more rapidly • than any of the 10 other most common • causes of death among persons over age 65.
Estimated that 80% of all COLDs directly related to smoking. Onset may be in 70s or 80s, even if stopped smoking decades earlier. S & S: productive cough, dyspnea, wheeze. If osteoporotic: Increased freq of # pink puffers blue bloaters. Treatment: bronchodilators, anticholinergic inhalers
Asthma • 10% of elderly Americans • Half of elderly asthmatic patients have • onset of symptoms after age 65. • Mortality 20-fold greater among adults • over age 45 compared to children. S & S: wheeze, SOB, chest tightness, non- productive cough, and persistent URTI.
6 Key Strategies to Manage Asthma 1. Education 2. Objective measurements of lung capacity 3. Environmental control 4. Pharmacological therapy for chronic asthma. 5. Pharmacological therapy for acute asthma. 6. Regular follow-up care. Symrnios NA. Asthma: a six-part strategy for managing older patients. Geriatrics 1997;52(2):36-44.
Other suggestions • cover mattress and pillow with plastic • damp wipe mattress every 2 weeks • wash bedding weekly in hot water • replace feather pillows • avoid basement bedrooms • cover air ducts with filters • maintain smoke-free environment • remove or vacuum any carpet weekly • humidity at 30-50% • wash pet regularly • increase ventilation with A/C Jones AP. Asthma and the home environment. J Asthma 2000;37:103-24
SMT and Asthma Although no change in FEV following SMT in a RCT, there were improvements in QOL, decreased drug usage and decreased symptoms. * Reviewers of the Cochran Library concluded that there was insufficient evidence to support or refute SMT for asthma. * Balon J et al. NEJM 1998;339:1013-1020 **Hondras MA et al. Cochrane Library, Issue 2, Oxford: 2000;17
Did SMT in addition to optimal medical management result in clinically important changes in asthma-related symptoms among children. Outcomes: Pulmonary function test; patient and parent rated asthma-specific QOL and asthma severity questionnaires; morning and evening peak expiratory flow rates; daily diary-based day and nighttime symptoms.
After 3 months, the use of SMT and optimal medical management children rated their QOL substantially higher and their asthma severity substantially lower. Bronfort G, Evan RC, Kubic P et al. Chiropractic pediatric asthma and chiropractic spinal manipulation: A prospective clinical series and randomized clinical pilot study. JMPT 2001;24(6):369-377.
Cancer • In general, rates of cancer declined 0.7% • between 1990-1995. • Death rates from 4 most common cancers • (lung, breast, prostate and colorectal) • all declined. • Likelihood of developing a cancer within • a person’s life: 40% • Primarily disease of the elderly, with age • the major determinant of cancer risk. • One third of all cancers occur in persons • over age 70.
May be related to prolonged exposure to environmental carcinogens. Decrease in mitochondrial activity Impaired cellular repair ability Impaired immune system
In the field of oncology • Because older patients thought to have: • poor prognosis • cognitive impairments • decreased quality of life • decreased social worth • limited life expectancy
They receive: • less screening for cancer • less staging for diagnosed cancer • less aggressive therapy, • and often no treatment at all. Older patients less likely to receive proper pain management for cancer Cleary JF, Carbone PP. Palliative medicine in the elderly. Cancer 1997;80(7):1335-47.
As A Result: Older patients are often labeled as being resistant to treatment, clinically uninteresting, and are often provided with only generic and narrow treatment options. Palmore EB. Ageism: Negative and Positive. New York: Springer Pub Co. Inc. 1999.
Lung Cancer • WHO estimates 3 million people die world- • wide due to Lung cancer, with highest rate • among North Americans. • 178,000 new cases a year • Most common cause of cancer death • (160,000 annually). • Incidence dropped among men since 1980s • Increased among women, more common • than breast cancer
Highest risk factor is smoking • Apparent by demographic studies with • a 20 year time lag. • 80-90% of lung cancer attributable to • smoking. • Proportional to both total number of • years person has smoked and number • of cigarettes person smokes. • Earlier quit: greater impact • 3,000 die/yr from second-hand smoke
S & S: Most cases untreatable at time of Dx. Lung cancer tends to be clinically silent until detected. Unexplained weight loss, dyspnea, chest pain, bone pain, haemoptysis, wheezing, signs associated with brain mets, recurrent and unresolving pneumonia. TNM Staging : Medically managed Prognosis: 5 year survival= 10-15%
Breast Cancer • Most commonly diagnosed cancer among • Canadian and American women, and second • only to lung cancer in terms of cancer deaths. • Affects 1:9 women. • 150,000 new cases a year. 44,000 deaths • 29% of all cancer among women • 18% of all cancer deaths • Among women age 15-54, leading cause • of cancer death. • 70% of cases dx in women over age 50.
Risk Factors Gender Age Exposure to estrogen Diet Genetic factors BRCA 1 and p53 (#17) Family History S-E factors (more common in high SE) Radiation exposure Personal history of endocrine cancer History of benign breast disease
In general, the longer a women exposed to estrogen, the greater her chance of developing breast cancer. ie early Menarche or late Menopause (late menopause =twice the risk). Some protection conveyed by pregnancy (related to increase in prolactin). BC Pill (?)
Also related to large body mass and abdominal obesity. Diet: increased risk with change in diet with more fat and total calories.
Screening Protocols Monthly self-examination Mammogram between age 35-40. Every 2 years between age 40 to 50 Yearly thereafter. S & S: non-painful, tender, firm palpable mass.
Treatment • Depends on stage of disease • Lumpectomy or mastectomy • lymph node dissection and radiotherapy. • Unconventional treatments: Iscador, 714-X, green tea, vitamin A,C, E. Essiac and hydrazine sulfate. Berestiansky J. Breast cancer: a current summary. Top Clin Chirop 1999;6(1):18-24.
Prognosis: related to presence or absence of axillary lymph nodes. Primary Prevention: exercise, balanced diet (antioxidants), increase in linolenic acid, decrease use of BC pill. Secondary Prevention: Breast self-exam. Clinical exam. Mammography. Tertiary Prevention: Post-op care, follow-up visits, patient education.
Prostate Cancer • 50% of men over age 70 have evidence of • prostatic cancer. • Second most common cause of death. • 244,000 diagnoses a year. 40,000 deaths • Afro-Americans have highest incidence • in world (1:9). Tends to be clinically silent. Often metastasis to bone
Screening: Digital rectal exam. PSA testing. Bone scan for mets. Medical management. TURP
Gynecological Cancers Endometrial cancer most common of gynecological cancers. Harbinger: Post-menopausal bleeding. Cervical: Second most common. Peak incidence fifth and sixth decade. Related to viruses. Ovarian: Less common, more deadly. Leading cause of gynecological cancers deaths in USA. Incidence is highest in 65-85 year old.
Colorectal & Pancreatic Cancer • Highly prevalent among older patients. • Second only to lung cancer as the most • common malignancy among both men • and women. • 90% of all cases occur over age 50 • 150,000 new cases/year. • Adenocarcinoma constitutes 95% of all • cases
Associated with diets that are high fat, high refined sugars and char-grilled meats and low fibre. Other risk factors: family history, IBD, polyps other colon tumors. Typically asymptomatic until found. Suspected if presence of occult blood, Fe- deficiency or abdominal mass.
Pancreatic Cancer • Fourth most common cancer in USA • 25,000 cases annually • Related to cigarette smoking, diabetes, • high -OH use, saturated fat and coffee, • chronic cholecystisis, exp to carcinogens. S&S: unexplained wt loss, jaundice, GI pain Prognosis: 5 year survival= 10%
Myeloproliferative Disorders CLL is most common leukemia among elderly. May be related to Epstein-Barr virus. Often incidental findings. • Multiple myeloma. More common among • Afro-Americans. Usually persons over age 50. • Genetic, radiation, toxins and viruses. • Bone pain most common presenting complaint • Multiple biconcave compression # on X-ray
Chronic Illness Recall studies by Hawk (JAGS 2000), Bressler (Spine 1999) and Rupert (JMPT 2000). • Estimated that 80-85% of all people will • experience a significant health problem • that predisposes them to pain after age 65. • 20-50% significant pain • 45-80% if in nursing home Gallagher et al. Sources of late-life pain and risk factors for disability. Geriatrics 2000;55(9):40-47.
BUT... • Prevalence of pain declines with age. • Age-related changes to nociceptors • More reluctant to report pain • Artifact of high mortality rates/institutionization. That said: 36-83% of elderly report pain interferes with ADLs and QOL. Mobily PR et al. An epidemiological analysis of pain in the elderly: the Iowa 65+ study. J Aging Health 1994;6:139-154.
Chronic pain in and of itself does not lower QOL. Related to changes in sleep, physical and social functioning, depression, and increased need for health services Symptoms of pain and depression intensify each other. Health related QOL scores of people with chronic non-malignant pain are among lowest observed for any medical condition. Gallagher et al. Ibid
Development of chronic pain influenced by: • Patient’s interpretation of pain. • patient’s reaction to pain. • Other biopsychosocial factors. • Score of MMPI • involvement of worker’s comp or litigation= • 90% more likely to develop chronic pain. Hoffman B. Confronting psychosocial issues in patients with low back pain. Top Clin Chirop 1999;6(2):1-7.
Breaking Bad News ‘situation where there is either a feeling of no hope, a threat to a person’s mental or physical well-being, a risk of upsetting an established lifestyle, or where a message is given which conveys to an individual fewer choices in his or her life’. Bor R et al. The meaning of bad news in HIV disease; counseling about dreaded issues revisited. Counsel Psych Q 1993;6:69-80.
However, different people interpret bad news differently. Depends on personality, interpersonal skills, news-specific variables, situation-specific. May only be confirming patient’s suspicion.
Must be certain of news before its conveyed! • Cannot be delegated to a surrogate • Jurisprudence dictates informing pt • Fortify rapport between patient and • doctor if done well. Conversely, if done • poorly, may impede patient’s long-term • adjustment to news.
Three ways to convey Bad News 1. Bluntly and insensitively 2. Kindly and sadly 3. Understanding, positive and flexible Key: Convey info in such as manner as to facilitate acceptance and understanding, minimizing risk of denial, ambivalence, unrealistic expectation, overwhelming distress patient.
Bowers L. “I’ve got some bad news…” Top Clin Chirop 1999;6(1):1-8.
Studies indicate that delivering bad news is stressful for the clinician as well. May be afraid will be blamed, fear of unknown, fear of unleashing emotional response from pt, discomfort of not having all the answers, personal fear of unknown or death. Therefore, clinician should not give news if he or she is anxious or uncomfortable. Beware of burn-out Ptacek JT et al. Breaking bad news. A review of the literature. JAMA 1996;276:496-502.
End of Life Issues • Palliative care • Provide dignity and comfort • Best QOL. • Address physical, mental, emotional and • spiritual needs. Encourage opportunities to reminisce. Be a good listener. Empower individual by involving them in own health care decisions.
Remind patient to have a ‘living will’. • What heroic means (DNR) • Organ donation • When to withhold care. • Can achieve ‘good death’ Fisher R et al. A guide to end-of-life care for seniors. University of Toronto and University of Ottawa. Health Canada 2000.
Recent study reported that half of caregivers (n=217) of patients with dementia reported spending at least 46 hours/week assisting with ADLs or IADLs. More than half reported that they were ‘on-duty’ 24 hours a day, that the patient has frequent pain and that the caregiver had to end or reduce employment owing to these demands.
Caregivers exhibited high levels of depression but showed remarkable resilience after the death of the person under care (symptoms of depression started to lift by 3 months). 72% of caregivers reported that they found the person’s death to be a relief to them, and 90% thought it was a relief to the patient. Schulz R et al. End-of-life care and effects of bereavement on family caregivers of persons with dementia. NEJM 2003;349(20):1936-42.
A recent study investigating the experience of 1578 patients who had died. Last place of care: 67% institution (1059) 33% at home (507) Of these 507, 198 (38%) did not receive nursing services, 65 had nursing services and 256 (49%) had home hospice service.
One quarter of all patients with pain or dyspnea did not receive adequate treatment, and one quarter reported concerns with physician communication. More than one third of patients under home health agency/nursing home/hospital care reported insufficient emotional support, compared to only 1 out of 5 patients receiving hospice care.
Family members of patients receiving hospice services were more satisfied with overall quality of care. * Many patients in institutions had unmet symptom amelioration, physician communication, emotional support, and being treated with respect. Teno JM et al. Family perspectives on end-of-life care at the last place of care. JAMA 2004;291(1):88-93.h
‘Hospice Model’ i. Each person is unique. ii. Everyone dies. iii. Comfort and happiness are very important. iv. Adverse consequences of medical evaluations and treatments. v. Compromise in carrying out plans. vi. Ability to treat without diagnosing. Goodwin JS. Geriatrics and the limits of modern medicine. N Eng J of Med 1999;340(16):1283-1285.