Download
1 / 22
220 likes | 228 Views
Applying Circular Statistics to the Study of Graduate Job Search: The Case of Great Britain. Alessandra Faggian 1 , Jonathan Corcoran 2 and Philip McCann 3 1 School of Geography, University of Southampton, UK 2 UQ Social Research Centre University of Queensland, Australia

E N D
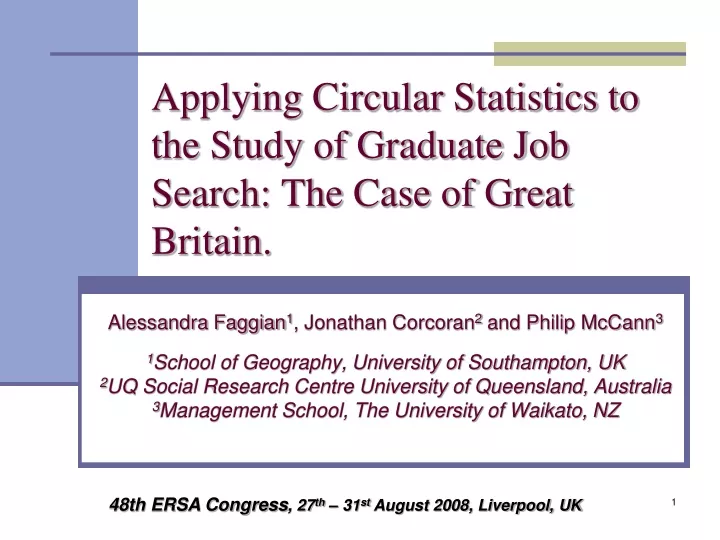
Applying Circular Statistics to the Study of Graduate Job Search: The Case of Great Britain. Alessandra Faggian1, Jonathan Corcoran2 and Philip McCann3 1School of Geography, University of Southampton, UK 2UQ Social Research Centre University of Queensland, Australia 3Management School, The University of Waikato, NZ 48th ERSA Congress, 27th – 31st August 2008, Liverpool, UK
Introduction • Role of space on the graduate labour market • How does human capital investment affect graduate migration patterns? • What are the geographical characteristics of the UK graduate job search areas? • How do University, personal and regional characteristics affect these movements?
Theoretical framework • Job search (e.g. Lippman and McCall 1976a,b and 1979) and human capital (Sjaastad, 1962) theories both predict that the radius of the job search area increases with an increase in human capital. So, assuming jobs are randomly distributed over space: Radius Expansion (all directions) Lower HK Higher HK
Theoretical framework • BUT, are jobs are randomly distributed over space? Aren’t higher quality/higher wage jobs more likely to be concentrated in urban areas rather than randomly scattered in space? • If this is the case, shouldn’t we observe a different pattern for people with different human capital levels? • In the case of University graduates, shouldn’t we observe different patterns between ‘high achievers’ (1 or 2.1) and ‘low achievers’ (2.2 or below)
Theoretical framework • We cannot talk about ‘radius’ of search. • The assumption of jobs being randomly distributed over space is a better approximation for less qualified job seekers “Attraction pole” Lower HK Higher HK
University Average distance moved by graduates (meters) Percentage of "migrants" Ranking (2001) The University of Cambridge 149,841 96.9 1 The University of Oxford 136,978 96.5 2 The University of Southampton 121,832 92.8 11 Strathclyde University 64,522 59.9 51 Liverpool Hope University 74,216 56.7 88 Thames Valley University 52,027 53.7 123 Theoretical framework • Traditionally, the summary measure used to describe graduate movements is the ‘average distance’ (linear measure) moved after graduation (which is a proxy for thesearch radius). So, according to expectations:
Theoretical framework • BUT, how do we capture the ‘shape’ of the job search area? • We need some non-linear (circular) measures, which allow use to identify: • The ‘direction’of graduate movements on top of the average distance moved using data at University level (circular average) • The ‘spread’of graduate movements (circular variance)
Methodology: Circular measures • A “curious byway of statistics…somewhere between the analysis of linear and the analysis of spherical data” (Fisher 1993, p.1) • Deal with directional data (either a compass direction or some unit of time) • Early roots date back to the mid-eighteenth century (Bernoulli, 1734) • Why circular measures???
3500 80 100 230 3400 Origin zone Individual journey to a job destination (i) Circular measures • Consider a hypothetical origin zone with 5 moves each with a single student centred around a northerly direction; • 3400, 3500, 80, 100, 230
3500 80 100 230 3400 Origin zone Individual journey to a job destination (i) Circular measures • Computing the standard linear mean (340 + 350 + 8 + 10 + 23 / 5) equates to 146.20, or around a south-easterly direction – the fallacy of the linear measure! Linear mean
Circular mean and circular variance and where And the circular variance R-bar (spread) is: 11
3500 80 100 230 3400 Origin zone Individual journey to a job destination (i) Circular measures • Applying the circular mean to the hypothetical example given above, equates to 2.230 or just around north. Circular variance = 0.035 (i.e. low spread) Circular mean Linear mean
(i) Circular measures • Compute for each origin zone and classify into sectors for thematic mapping • Number of sectors determined by data • 4 sectors • 8 sectors etc 337.50 to 22.50 8 sectors (450 slices)
Data • ~12 million observations on students in the academic years between 1995/96 and 2005/06 • (Source: Students Data by HESA) • ~1.5 million observations on graduates jobs (Sources: First Survey Destination, 95-00 and Destination of Leavers in Higher Education by HESA, 2002-05) • Focus in this paper: 1999/2000 cohort (~300,000 observations)
2. ‘Spreads’: examples… HEI n.114: low variance UNIDIRECTIONALITY Mean Vector (µ) 214.975° Variance (R) 0.357 Mean Vector (µ) 214.975° Variance (R) 0.357 Mean Vector (µ) 215.307° Variance (R) 0.347 15km TTWA 50km Different definitions of non-migrant Average direction
HEI n.90: high variance MULTIDIRECTIONALITY Mean Vector (µ) 54.218° Variance (R) 0.743 Mean Vector (µ) 67.111° Variance (R) 0.744 Mean Vector (µ) 35.652° Variance (R) 0.543 15km TTWA 50km 95% confidence interval Average direction
Different definitions of ‘non-migrant’ Results for the 15km radius area and TTWAs are incredibly similar, with the only exception of HEIs located along the border between two TTWAs (in which case the 15Km might even be preferable)
3. Determinants of spread of movements Based on previous work on graduate migration in GB (Faggian and McCann 2006, Faggian et. al 2006, 2007a and b) andon human capital migration theory and gravity type models, we expect the circular variance to be related: POSITIVELY (more randomly distributed movements) NEGATIVELY (more focused movements) • Selectivity of HEI attended • Degree classification obtained • Age of graduates • Degree of specialisation of HEI attended • Spatial constraints of HEI location (coast) • London attraction • Previous migratory behaviour (distance moved from home to HEI) • Ethnic minority status • Female students ??? • Subjects • Socio-economic background
Conclusions • More selective Universities (Russell or 94 group) tend to produce more ‘focused’ out-migration movement (low variance) • Also the case for more specialised HEIs (as measure by the Herfindhal index) • Mature graduates and those with a higher HK (2:1 or first) tend to move further, BUT are more ‘focused’ • Female and black students tend to search in different directions (more locally) • Attraction of London (higher of % jobs there makes movements more focused) • Subject dummies significant (Education, Maths and Engineering) tend to be associated with greater spread of movements • Correction for Coastal proximity