Download
1 / 18
180 likes | 320 Views
Military spending. Arms suppliers Source: Stockholm International Peace Research Institute. Philippines update.

E N D
Military spending Arms suppliers Source: Stockholm International Peace Research Institute
Philippines update • There is great unevenness in the distribution of wealth in the Philippines. A small percentage of the population is very wealthy while the majority of the people are very poor. The richest 10% of the population share over one third of the wealth while the poorest 10% share only 2.3% with 40% living below the poverty line. Nearly 10% of GDP is from Filipinos working overseas. • http://www.youtube.com/watch?v=CwNtQXMqznY • 90 million people • 40 percent in poverty • 1.5 million homeless street kids The economy of the Philippines is the 4th largest economy in South East Asia and the 33rd largest economy in the world by purchasing power parity according to the International Monetary Fund in 2010. A newly industrialized emerging market economy, it posted a real GDP growth rate of 5.3% in 2006 and 7.1% in 2007. Growth slowed to 3.8% in 2008 as a result of the global financial crisis. In 2009, the real growth rate was 0.9%.The Philippine economy grew by 7.3% in 2010, which several reports described as the fastest growth in 24 years.
Update Philippines • There is a high incidence of child prostitution in tourist areas. An undetermined number of children are forced into exploitative labor operations. • The Philippines is the fourth country with the most number of prostituted children,and authorities have identified an increase in pedophiles travelling to the Philippines. • There are estimated to be 375,000 women and girls in the sex trade in the Philippines, mostly between the ages of 15 and 20, though some are as young as 11. • The International Federation of Red Cross and Red Crescent Societies state that there are more than 1.5 million street children in the Philippines and many end up in prostitution and drug trafficking in places such as Manila and Angeles City. • Government and NGO estimates on the number of women trafficked range from 300,000 to 400,000 and the number of children trafficked range from 60,000 to 100,000. • According to the US government reports, the number of child victims in the Philippines range from 20,000 to 100,000, with foreign tourists, particularly other Asians, as perpetrators.
Who will have the most influence on economic priorities and distribution of resources such as education, land, health care, etc. Who will be given the highest priority in the decision making processes?
Source: SIPRI Yearbook 2009, Note: Some countries are excluded because of lack of data or consistent time series data.
Source: SIPRI Yearbook 2009, Table 5A.1, see also The SIPRI military expenditure database.
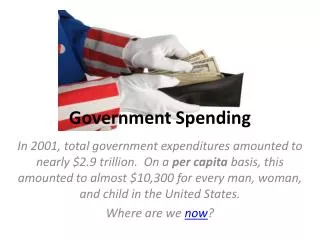
Defense Spending & The Military Budget • Congress and the White House allocate $522 billion a year to the Defense Budget. (In 2008 the U.S. spent $607 billion) To put the level of U.S. Defense Spending in perspective.• $30 billion is the annual shortfall to eliminate starvation and malnutrition globally.• $12 billion is the annual shortfall to provide education for every kid on earth.• $15 billion is the annual shortfall to provide access to water and sanitation.• $23 billion is the annual shortfall to reverse the spread of AIDS and Malaria. Source: World Bank
During the eight-year presidency of George W. Bush, US military expenditure increased to the highest level in real terms since World War II, mostly due to the wars in Afghanistan and Iraq. This increase has contributed to soaring budget deficits. The conflicts in Afghanistan and Iraq have been funded primarily through emergency supplemental appropriations outside the regular budgetary process and have been financed through borrowing.
The five largest suppliers of major conventional weapons, 2004–2008
Since 2005 there has been an upward trend in deliveries of major conventional arms world wide. The annual average for 2004–2008 was 21 per cent higher than for 2000–2004. The United States and Russia remained by far the largest exporters, followed by Germany, France and the United Kingdom. Together these five countries accounted for 79 per cent of the volume of exports for 2004–2008. They have been the top five suppliers since the end of the cold war and have accounted for at least three-quarters of all exports annually.
East Asia, Europe and the Middle East continued to be the largest recipient regions for 2004–2008, each accounting for about 20 per cent of all imports. China remained the single largest recipient for the period 2004–2008, followed by India, the United Arab Emirates (UAE), South Korea and Greece.
Global arms production continued to increase in 2007. The combined arms sales of the SIPRI Top 100 arms-producing companies reached $347 billion an increase of 11 per cent in nominal terms and 5 per cent in real terms over 2006. Since 2002 the value of the Top 100 arms sales has increased by 37 per cent in real terms.
Forty-four US companies accounted for 61 per cent of the Top 100’s arms sales in 2007 32 West European companies accounted for 31 per cent of the sales. Russia, Japan, Israel and India accounted for most of the rest. Thirty companies increased their arms sales by more than 30 per cent in 2007.
It includes Trust Funds (e.g., Social Security). The expenses of past military spending are not distinguished from nonmilitary spending. The pie chart below is the government view of the budget.
The figures are federal funds, which do not include trust funds — such as Social Security — that are raised and spent separately from income taxes. The government practice of combining trust and federal funds began during the Vietnam War, thus making the human needs portion of the budget seem larger and the military portion smaller. If the government does not have enough money to finance a war (or spending for its hefty military budgets), they borrow through loans, savings bonds, and so forth. This borrowing (done heavily during World War II and the Vietnam War) comes back in later years as "hidden" military spending through interest payments on the national debt. War Resisters League version of the budget
The U.S. Government says that military spending amounts to 20% of the budget, the Center for Defense Information (CDI) reports 51%, the Friends Committee on National Legislation (FCNL) reports 43%, and the War Resisters League claims 54%. Why the variation? Different groups have different purposes in how they present the budget figures. WRL’s goal has been to show the percentage of money that goes to the military (current and past) so that people paying — or not paying — their federal taxes would know what portion of their payments are military-oriented.
U.S. Military Spending vs. The World U.S. military spending – Dept. of Defense plus nuclear weapons (in $billions) – is equal to the military spending of the next 15 countries combined. Some say that U.S. military spending will naturally be higher because it has the highest Gross Domestic Product (GDP) of any country. The United States accounts for 47 percent of the world’s total military spending, however the U.S.’s share of the world's GDP is about 21 percent. Also note that of the top 15 countries, at least 12 are considered allies of the U.S. The U.S. outspends Iran and North Korea by a ratio of 72 to one. Source: Center for Arms Control and Non-Proliferation, http://old.armscontrolcenter.org/archives/002279.php; our graph uses a more comparable figure of $515 from actual 2006 U.S. military spending
Questions • What might these figures tell us about generalized, balanced, or negative reciprocity as economic strategies? • What might happen if at least some of the money used for military was used to build relationships through reciprocity? • Does military spending in this quantity reflect a gender bias if we apply the theories about female and male priorities in regard to power and resources? Why or why not?