Download
1 / 22
220 likes | 399 Views
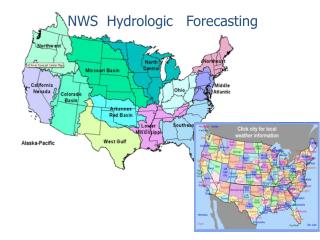
Using Ensemble Model Output Statistics to Improve 12-Hour Probability of Precipitation Forecasts. John P. Gagan NWS Springfield, MO Chad Entremont NWS Jackson, MS. Wet PoP. TROUBLE. Dry PoP. GOOD. The Problem. Dry Bias Improvement noted with No Precip

E N D
Using Ensemble Model Output Statistics to Improve 12-Hour Probability of Precipitation Forecasts John P. Gagan NWS Springfield, MO Chad Entremont NWS Jackson, MS
Wet PoP TROUBLE Dry PoP GOOD
The Problem • Dry Bias • Improvement noted with No Precip • Forecaster not as “wet” as GFS MOS when there is Precip • National problem • Almost all areas exhibit same tendencies • Issues in both cold and warm seasons
The Problem (con’t) • PoP definition • The probability of occurrence of measurable precipitation (0.01 inch) at a given point for each 12-hour period through Day 7. • The Interpretation • In spite of a straightforward definition, it’s as unique as the individual asked • “PoPs ‘look’ too high today” • “It’s not going to rain that much, so I’m lowering PoPs” • “I never go likely beyond 48 hours”
A Generic Forecast ‘In Words’ • “Models increasing PWs to 200% of normal” • “High Θe air being pumped into region by 50kt LLJ” • “Area in right entrance region of ULJ” • “Large area of rain and embedded thunderstorms will move over the area today” • And so on…
A Generic Forecast ‘By Numbers’ • MOS PoP Forecasts • MAV – 90% • MET – 85% • Ensemble MOS – 80% • Forecaster’s PoP • 70% area wide
What Happened? • Numerous reasons why it WILL rain • Yet, the forecast is drier than MOS • Why? • Mistrust/misunderstanding of MOS? • Lack of understanding of the 12-hr PoP? • Reasons vary by individual • The main issue - CONFIDENCE
A Solution • Ensemble MOS • Started April 2001 • Currently a 16-member suite • Operational MEX • Control Run • 14 Perturbations • Run 1-time per day (00z issuance) • A bulletin is created showing the Max/Min/Avg of MOS output
A Solution (con’t) • Use the Ensemble Average PoP as a means to improve PoP forecasts • DO NOT use the ensemble average value as an EXPLICIT forecast • Use the ensemble average value as CONFIDENCE factor • The higher the ensemble average, the more confidence in precip occurrence
Data Manipulation • This investigation is for the COLD SEASON ONLY! • October to April • Data collected from Oct 2003 – Apr 2006 • Investigated 6 sites • SGF CWFA – KSGF, KVIH • JAN CWFA – KGWO, KTVR, KJAN, KMEI
Data Manipulation (con’t) • ~ 4000 data points collected • Stratified by rain/no rain • Periods 1-10 studied (Days 1-5) • Graphs produced to highlight rainfall frequency for a given value of the ensemble average PoP • Ensemble Average PoP is NOT used as a PoP but a confidence factor
Cases Rain / All Cases 371 / 390 891 / 1046 1127 / 1501 7 / 3172 43 / 4496
Cases Rain / All Cases 24 / 25 613 / 715 966 / 1297 5 / 2523 66 / 4372
Cases Rain / All Cases 397 / 471 776 / 1084 7 / 1950 99 / 4149
Cases Rain / All Cases 211 / 263 891 / 1046 19 / 1217 109 / 3770
Cases Rain / All Cases 221 / 344 559 / 992 55 / 1823 143 / 3253
Using Ensemble PoP in Real Time • Using the ensemble average alone does well • However, using this in tandem with the full suite of models/guidance is best • SREF – (Probabilities from SPC web page) • Other global models • Mesoscale models • The more datasets that say “YES” should increase confidence and result in a better quality PoP
Observations and Further Study • Watch the day-to-day trend of the ensemble average PoP • If the value increases for a particular period, confidence increases • Should be able to hone in on 1-3 12-hour periods (“windows of opportunity”) • Watch for MEX PoP values LESS THAN the ensemble average • Observation has shown that it does not rain as often
Questions, Comments? • If you are interested in this study, we’d like to hear your opinions • John.Gagan@noaa.gov • Chad.Entremont@noaa.gov